


What to know:
- Ethereum gains around 1.50%, with price action strengthening near the key $2,270 breakout resistance level.
- Short-term momentum improves as ETH trades above key support zones, but the overall trend remains range-bound with no confirmed breakout yet.
- Technical signals show mixed strength: RSI near 60 and MACD bullish crossover suggest early recovery, though confirmation is still needed.

Ethereum has some indications of a recovery phase following its indecisive trading for the day. Over the short-term period, there seems to be an improvement in momentum, although prices still remain sensitive to resistance areas.
At the time of writing, Ethereum is trading at $2,244.89, showing a 1.50% gain over the last 24 hours. The ETH recorded a daily trading volume of $22.44 billion and holds a market capitalization of $270.35 billion, reflecting steady market participation.

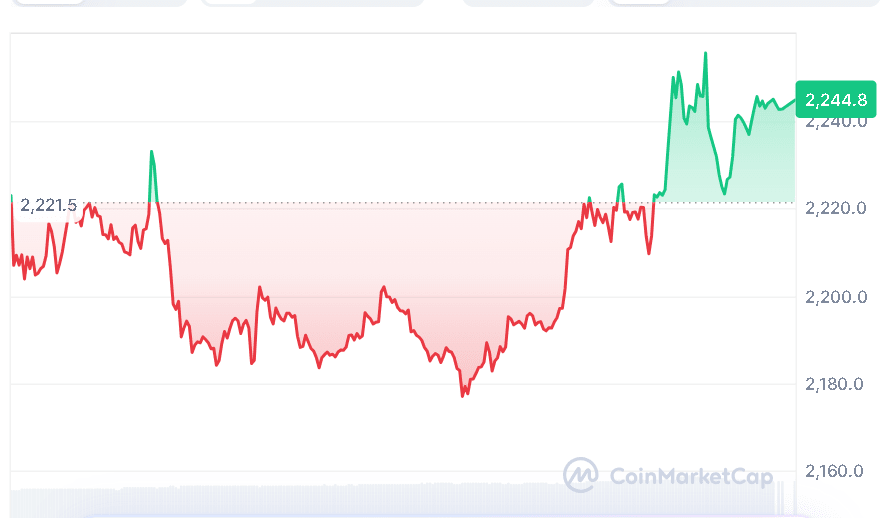
Source: CoinMarketCap

Also Read | NEAR Protocol (NEAR) Rally Gains Strength as Bulls Eye $1.40 Resistance
Ethereum Awaits Clear Breakout Signal
According to the crypto analyst CRYPTOWZRD, in the daily technical analysis posted on April 10, 2026, Ethereum finished the trading session directionless. In addition, the intraday chart depicts erratic price action, showing alternations between upswings and downswings, but lacking any definite trend pattern.

Source: CRYPTOWZRD’s X Post
In accordance with the technical analysis, breaking through the $2,270 level could pave the way for upward momentum and a possible buy setup in the following trading session. On the other hand, a lack of breaking through the said level might lead to a prolonged consolidation phase.
However, CRYPTOWZRD found that the daily candle had closed without decisiveness and that there was some weakness seen when looking at ETH compared to Bitcoin. Market dynamics such as Bitcoin dominance will continue to play a major role in determining the direction of the altcoin.
Further macros highlighted, including geopolitical issues in the Middle East region that may influence market sentiments and move closer to the $2,700 resistance point. With increased momentum, Ethereum may head towards $2,800 or even beyond. Any weakness below $2,200 may indicate a further downward move towards the $1,800 support.
Intraday Range Shows Tight Behavior
The near-term price movement is varied. Ethereum moves in a consolidation range but fails to break out clearly. The momentum direction is unclear, hence investors look for confirmation points. If there is an upward breach past $2,270, there is potential for a continuation trend to the upside.
ETH Technical Indicators Turn Positive
The current price of Ethereum stands at $2,249, and the RSI is at 60.41, indicating moderate bullish momentum. The asset is still within bearish territory, though.
The moving averages configuration still reflects support on the short term. The price is trading above both 20-day and 50-day SMAs at $2,104 and $2,069, respectively. Nevertheless, the asset is still trading below the 100-day SMA at $2,376 and the 200-day SMA at $2,937.

Source: TradingView
The momentum oscillators are performing better. The Moving Average Convergence Divergence (MACD) line (27.07) moved above the signal line (18.18). This is further supported by the histogram showing positive divergence (+8.18). There are early signs of an upward trend, but more validation is required for confirmation.
This article contains market analysis and price predictions. These are not guarantees. Crypto markets are volatile. Always DYOR. Not financial advice.
Also Read | Hong Kong Grants First Stablecoin Licenses to HSBC, Anchorpoint

Be the first to comment