


What to know:
- Ethereum holds key support as aggressive buyers drive renewed bullish momentum
- Strong volume surge and $390 million demand signal rising confidence in Ethereum
- Technical indicators align as ETH gains strength above major support levels


Ethereum holds key support as aggressive buyers return across derivatives markets. Net taker volume surged to $390 million, signaling renewed bullish momentum.
ETH trades near $2,162 after gaining nearly 5% in the past 24 hours, according to CoinMarketCap. Rising volume confirms strong participation across the crypto market.

Aggressive Buyers Return as Net Taker Volume Reaches $390 Million
CryptoQuant analyst Amr Taha posted the chart of a huge spike in Ethereum net taker volume on Binance. The total amount of net taker volume was nearly $390 million. The previous high for the net taker volume was $328 million before rising to $330 million on March 18th.
Net taker volume shows the difference between the number of market orders placed by aggressive buyers versus those by sellers. A positive reading confirms that aggressive buyers are actively taking positions.
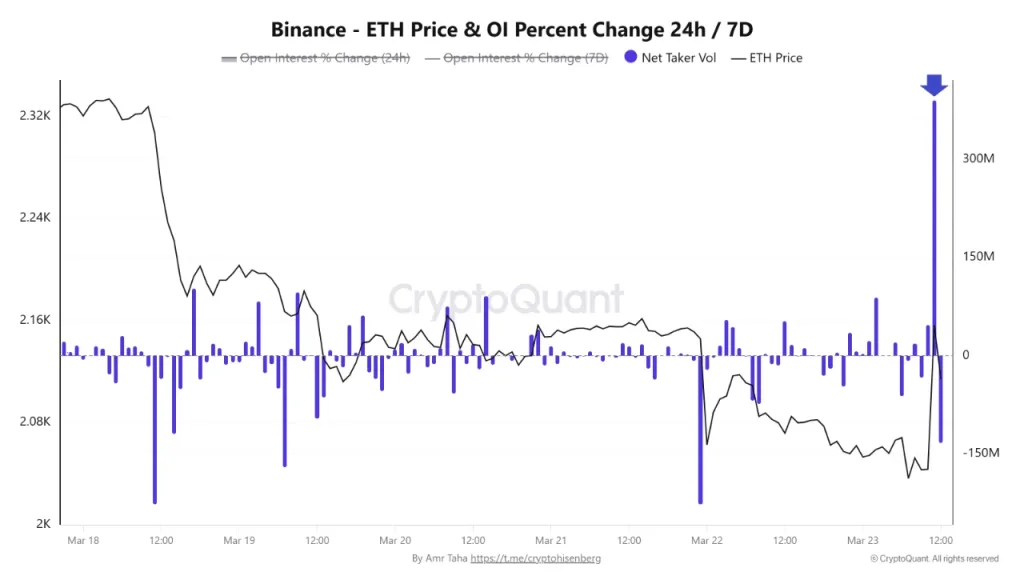
Taha stated in his post that he believes this large spike in net taker volume reflects strong buyer participation. This happened after an improvement in overall market sentiment. This improvement was due to a recent post on Truth Social made by President Donald Trump about easing the threat of war.
The easing of geopolitical tensions has positively impacted risk sentiment globally. Therefore, investors have sought out alternative investments like cryptocurrencies and Ethereum.
Also Read | Ethereum Holds Crucial $2,080 Support as Market Signals Hidden Accumulation
Ethereum Shows Strongest Trading Activity Support Level
Market data published by analysts at Bitcoinsensus indicates that Ethereum has reached its highest volume node in the last five years. Historically, these types of support levels indicate the degree of price acceptance and trading activity.
High-volume nodes often act as a type of “floor” during periods of price consolidation or trend continuation. Since the price continues to remain around the high-volume node level, the long-term players are still buying the asset at current prices.
This structure suggests that Ethereum is currently within a stable demand zone, regardless of the volatility experienced recently. This increases the chances of the price continuing upward if the current trend continues.
Technical Analysis Confirms Bullish Momentum
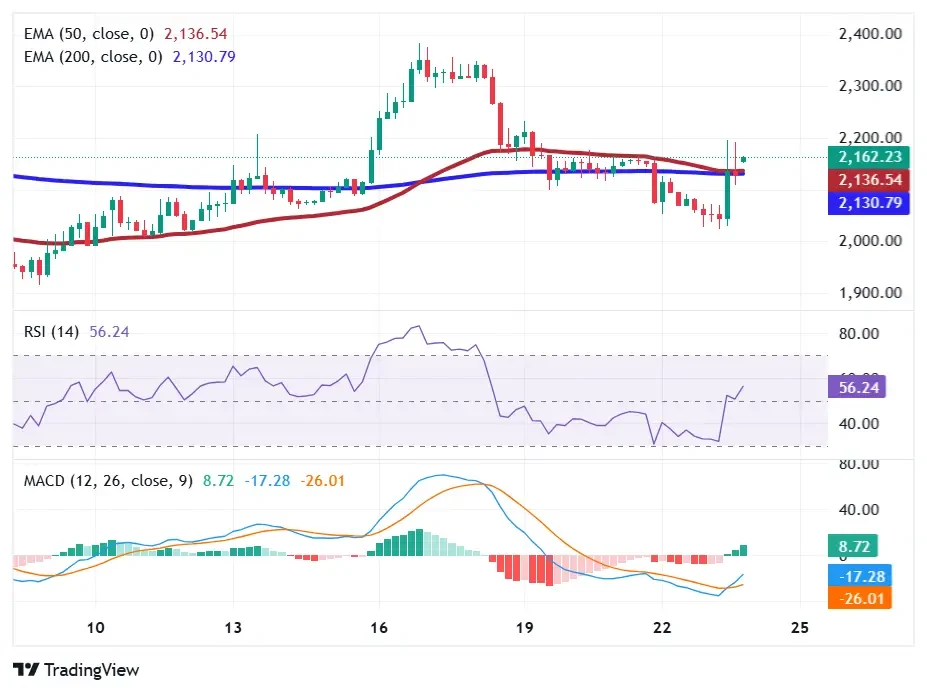
ETH trades above both the 50-day and 200-day exponential moving averages (EMAs), per TradingView chart. Both EMAs fall within the $2,130 to $2,136 range and serve as support zones for the coin.
Additionally, the relative strength index (RSI) is at around 56, showing that the bulls are maintaining moderate momentum without reaching overbought territory yet. This increases the probability of additional price appreciation if demand continues to grow.
Moreover, the MACD indicator has turned upward, suggesting a possible bull run may begin soon. The histogram has also turned green, which confirms the early signs of a recovery in price.

If the Ethereum price can remain above the two key moving averages, additional price appreciation may occur in the short term. Continued demand will be necessary to confirm a full trend continuation. However, failure to sustain demand could weaken the current bullish structure.
This article contains market analysis and price predictions. These are not guarantees. Crypto markets are volatile. Always DYOR. Not financial advice.
Also Read | Ethereum (ETH) Loses Momentum: Is a Drop to $1,500 Back in Play?

Be the first to comment