


What to know:
- Ethereum exchange inflows hit their lowest point since May 2025, easing selling pressure
- ETH holds firm above key monthly support as long-term holders move coins off exchanges
- On-chain data suggests Ethereum may be quietly building a base around the $2,330 level


Ethereum inflows to Binance have dropped to a 10-month low, signaling a sharp decline in potential selling pressure as ETH holds above a key support zone. On-chain data from CryptoQuant shows exchange deposits falling significantly, pointing to a shift toward accumulation.
Ethereum is trading near $2,330, according to TradingView data. The reduced inflows suggest investors are increasingly choosing to hold rather than sell.


Source: TradingView
Lower Exchange Deposits Correlate With Less Selling Activity
Arab Chain analyzed data on crypto exchange inflows and concluded that there is a shift in investor behavior. On-chain data suggests that investors are placing their coins in cold storage or private wallets, which reduces the number of coins available to sell. This leads to less liquidity on the exchange and less selling pressure.
Historically, low exchange deposits have correlated with either a period of consolidation or accumulation in the cryptocurrency market. Conversely, large spikes in exchange deposits have been correlated with higher volatility and greater selling pressure, with the market experiencing a strong rally.
A tighter supply in liquidity on crypto exchange platforms means that the Ethereum price will be more sensitive to demand, particularly if investors’ sentiment about the cryptocurrency becomes more positive.

Source: CryptoQuant
Also Read | Ethereum Reclaims Strength Above $2,200 as Bulls Eye $2,400 Breakout
ETH Price Maintains Monthly Support Zone
TradingView technical analysis shows that the ETH price continues to stabilize above a key monthly support zone between the $1,900 and $2,100 levels. Based on the price movements of Ethereum, there appears to be a reaction occurring at the support zone.
The ETH price remains above the 50-period EMA, supporting the overall trend structure of the price movement. A chart posted by Bitcoinnensus on X shows that Ethereum is exhibiting a reaction from a major monthly support zone that has served as a structural base multiple time previously.
The reaction to the support zone may continue to provide a base for the Ethereum price. This would allow for continued price stabilization or further price increases, depending on the level of buying interest.
The momentum indicators, such as RSI, are indicating that the market is currently in equilibrium. Volume has been trending steadily, which supports the view that the coin’s price is establishing a bottom and won’t break down further.
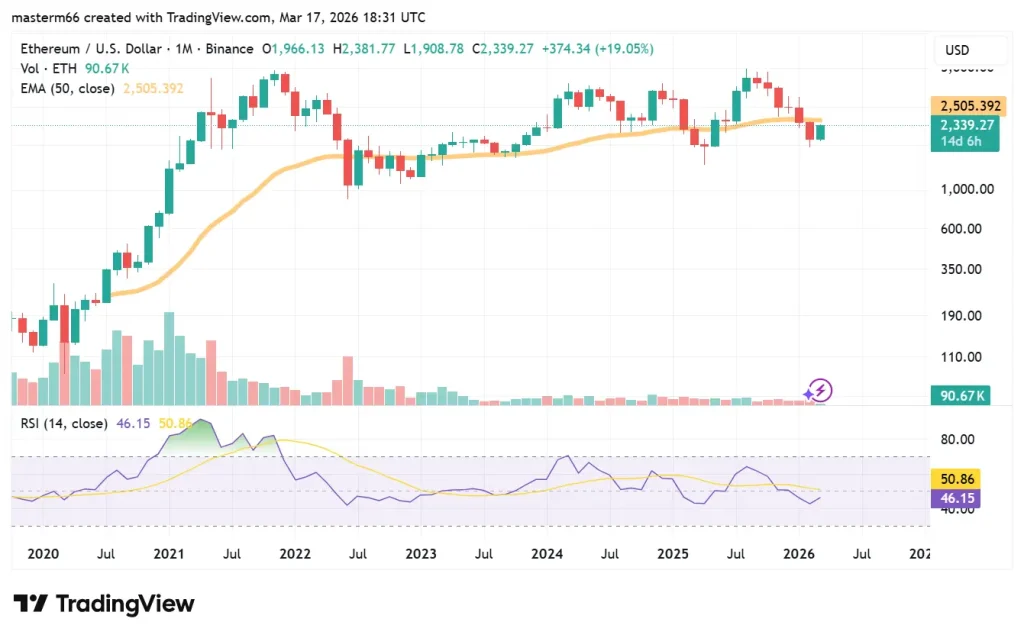
Source: TradingView
Why This Matters
Falling exchange inflows combined with strong support levels could reduce selling pressure and position Ethereum for a potential move higher.
This article contains market analysis and price predictions. These are not guarantees. Crypto markets are volatile. Always DYOR. Not financial advice.
Also Read | Ethereum Dominates $200 Billion Tokenized Market With Unmatched Strength

Be the first to comment