


Here is a technical analysis of ETH/USDT on a daily timeframe:
Market Structure
Ethereum is still moving within a broader downtrend. Nothing has changed in the bigger picture. The price bounced from $1,800, but it has failed to create strong higher highs, which indicates that buyers remain weak overall. Right now, the structure is:
- Short-term: Sideways to slightly bullish
- Overall trend: Bearish
Also Read: A Journey That Began in 2017: Shashi’s Story with ZebPay
Recent Price Action
Earlier, ETH was moving within a rising channel, showing short-term strength. Now, here’s what has happened:

- Price attempted to move higher toward $2,300–$2,400
- Got rejected again from that zone
- Dropped back near $2,050-$2,100
- Currently trying to stabilize
This clearly indicates that buyers are unable to push the price higher.
Volume is Supportive but Not Strong
- No strong volume during upward moves
- Volume is relatively average
- No signs of aggressive accumulation
This does not indicate a strong bullish move.
Also Read: Shiba Inu Price Prediction
Resistance Levels
- $2,200 – Immediate Resistance (The price is struggling below this level again)
- $2,300–$2,400 – Strong Resistance (Multiple rejections from this zone, with sellers clearly active here)
- $2,700–$2,800 – Major Resistance [This remains the level that needs to be broken for a true trend reversal (still far away for now)]
Support Levels
- $2,000 – Immediate Support (A very important level right now, with the price hovering just above it)
- $1,800 – Strong Support (If the price drops here again, it suggests that the entire bounce has failed and further downside is possible)
At the time of writing, ETH was trading at $2,072.
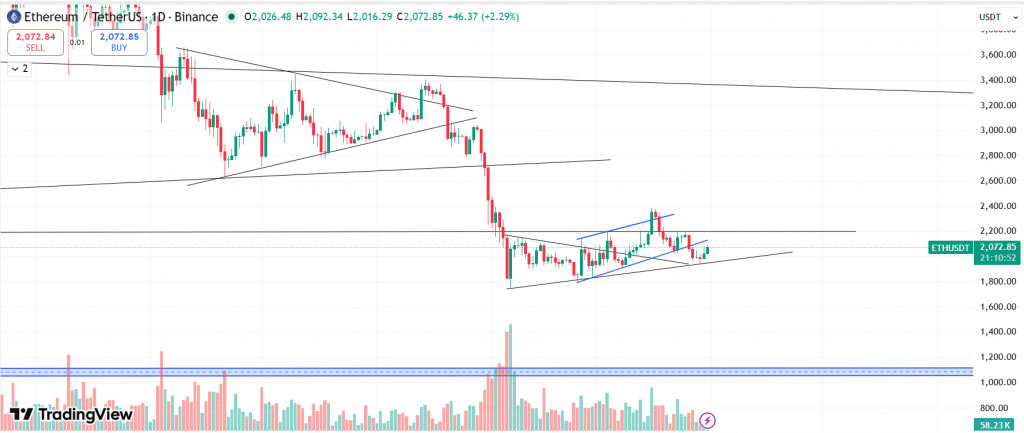
Summary: Ethereum is currently trading around $2,070 and moving sideways after failing multiple times to break above the $2,200–$2,400 resistance zone. Although there was a bounce from $1,800, the price has not shown strong follow-through, and buying momentum remains weak with no significant volume support. This suggests the move is more of a temporary recovery rather than a true trend reversal. As long as ETH remains below $2,200, the overall structure stays bearish, and a drop toward $2,000 or even $1,800 remains possible if support breaks.
Also Read: Dogecoin Price Prediction
Key Levels
| Support 2 | Support 1 | Asset | Resistance 1 | Resistance 2 |
| $1,800 | $2,000 | ETH | $2,200 | $2,400 |
In the grand scheme of things, ZebPay blogs are here to provide you with crypto wisdom. Get started today and join 6 million+ registered users to explore endless features on ZebPay!
Disclaimer:
Crypto products and NFTs are unregulated and can be highly risky. There may be no regulatory recourse for any loss from such transactions. Each investor must do his/her own research or seek independent advice if necessary before initiating any transactions in crypto products and NFTs. The views, thoughts, and opinions expressed in the article belong solely to the author, and not to ZebPay or the author’s employer or other groups or individuals. ZebPay shall not be held liable for any acts or omissions, or losses incurred by the investors. ZebPay has not received any compensation in cash or kind for the above article and the article is provided “as is”, with no guarantee of completeness, accuracy, timeliness or of the results obtained from the use of this information.

Be the first to comment