


What to know:
- GALA signals a bullish reversal after a CISD pattern, holding near $0.00362 for a strong risk-to-reward setup.
- RSI and MACD show early bullish momentum as selling pressure eases.
- A breakout above CISD and EMAs could trigger a fast move toward higher liquidity levels.


GALA is showing signs of a potential bullish reversal on the daily timeframe after printing a change in state of delivery (CISD), a key smart money concept signal that suggests selling pressure may be fading.
According to the crypto analyst Crypto Patel, the price remains in a discount zone near $0.00362, offering traders a favorable risk-to-reward area while the invalidation level sits around $0.00317.


Source: Crypto Patel’s X Post
Liquidity is currently stacked above the market, with upside targets near $0.00415, $0.00438, and $0.00469 attracting trader attention.
In SMC theory, price often moves toward liquidity pools, meaning a confirmed break and retest of the CISD level could trigger a fast move upward as buyers step in and momentum strengthens toward those zones.
Also Read: GALA and NEAR in Focus as Analyst Points to High-Conviction Technical Levels
GALA Faces Pressure Below Key Moving Averages
According to TradingView, GALA has a strong downtrend from late 2025 to 2026, as shown in the above chart. The asset’s price remains low compared to major exponential moving averages, which indicates a strong downtrend.
A sharp fall in February 2026 has pushed the asset to a low of $0.0028 before stabilizing. The 200-day exponential moving average remains high compared to current levels, indicating a strong sell trend in the GALA.

Source: TradingView
Recently, GALA has been in a consolidation period as the token is trading in tight ranges within narrow Bollinger Bands around $0.0036.
The asset also reclaimed its 20-day EMA. However, the token is finding resistance at its 50-day EMA around $0.00430. A breakout above this is required for a change in the market structure to a bullish price recovery period.
Momentum Indicators Support Cautious Outlook
Currently, the Relative Strength Index is at 48.46, which indicates a neutral market sentiment for GALA. This means that the asset is neither overbought nor oversold.
In the recent past, the relative strength index line has crossed above the signal line, which indicates a rise in bullish momentum; however, it has to move above 60.00 to confirm a breakout.
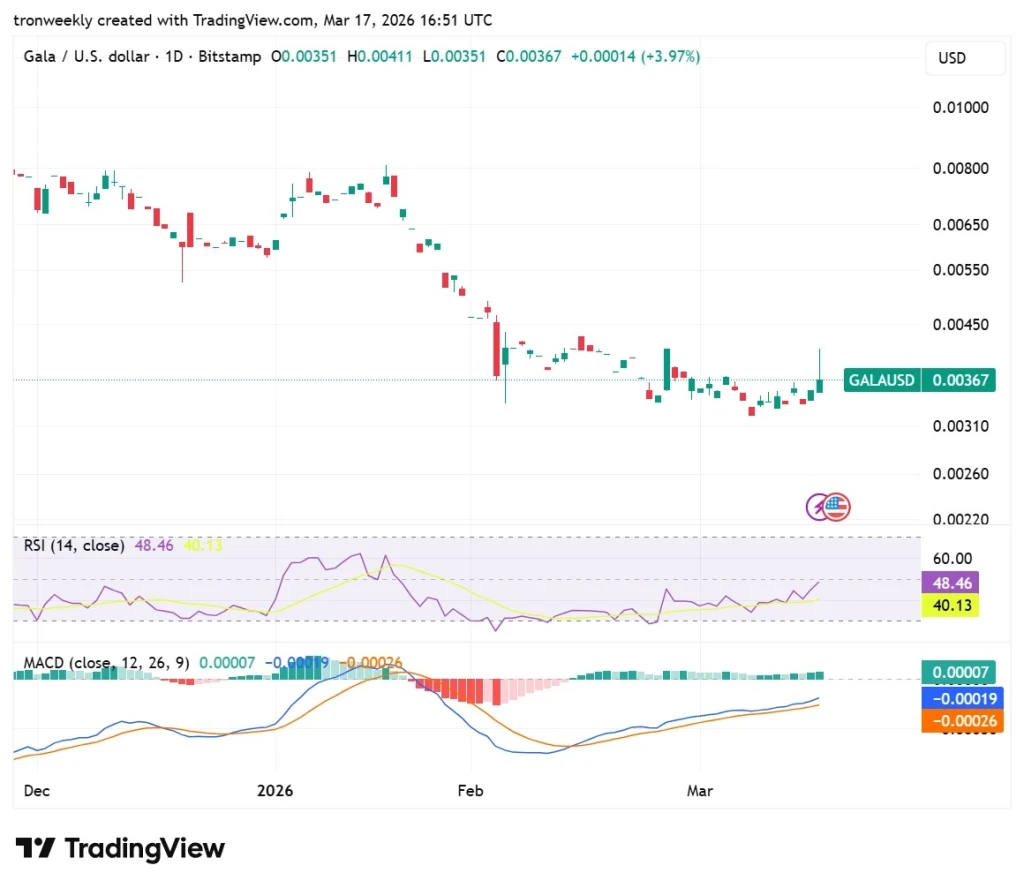
Source: TradingView
The MACD shows an optimistic view as the blue MACD line crosses above the orange signal line. This is also confirmed by the histogram as it turns green, an indication that the selling pressure is easing off.
Although it is still in negative territory below the zero baseline, the direction indicates that the buyers are taking control of the trend.
This article contains market analysis and price predictions. These are not guarantees. Crypto markets are volatile. Always DYOR. Not financial advice.
Also Read: GALA Consolidation Indicates a Potential Rebound Toward $0.0044 Target
Be the first to comment