


What to know:
- HBAR nears the $0.093 accumulation zone, signaling strong buyer interest and potential support.
- Sustained buying pressure around this level could propel HBAR toward the $0.40 mark.
- Reclaimed 20-EMA and 50-EMA, along with bullish MACD and rising RSI, indicate short-term upward momentum.


Hedera (HBAR) is nearing a crucial accumulation level around $0.093, where significant trading activity has historically occurred. According to crypto analyst Crypto Pulse, this concentration of volume suggests strong buyer interest, creating potential support.
While the price hasn’t fully reached this zone, market participants are closely watching, anticipating that demand could emerge as HBAR approaches this critical threshold.

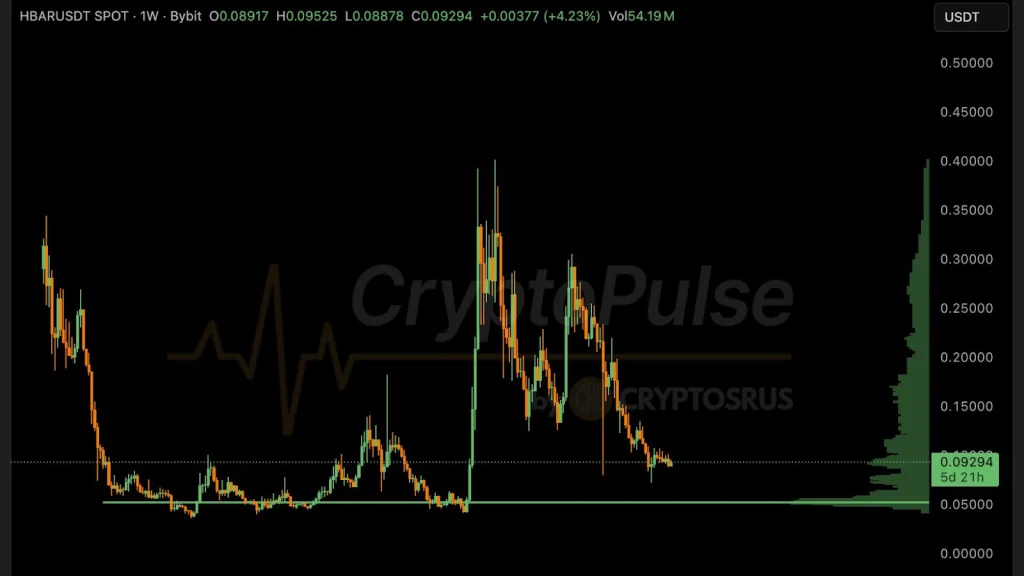
Source: Crypto Pulse’s X Post
If this zone of accumulation is sustained, it might serve as a basis for the next upward swing, which might carry HBAR to the level of $0.40.
Crypto Pulse has noted that this buying pressure might be a sign that the market is ready to witness upward momentum in general.
Traders are keenly observing this zone of accumulation, waiting for early signs of it before they position themselves for a possible rally.
Also Read: Hedera Hashgraph (HBAR) Rally Incoming: Key Resistance Could Trigger $0.20+ Move
HBAR Technical Outlook Points to a Bullish Reversal
According to TradingView, Hedera is experiencing a resurgence after falling to $0.0890. The token has managed to rise above the 20-EMA and the 50-EMA, indicating bullish momentum.
However, the asset is yet to overcome the stubborn resistance at the 200-EMA, which is trading at $0.0961. A breakout above this point will be crucial to determining the trend towards higher resistance.
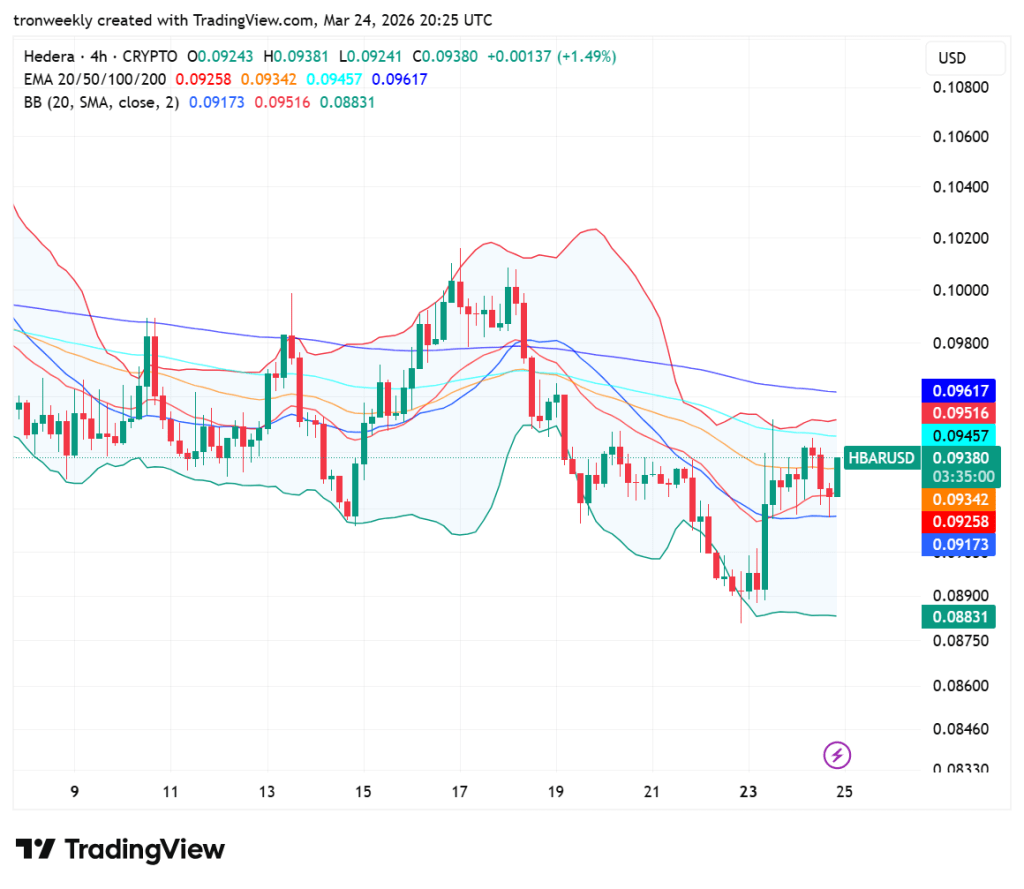
Source: TradingView
The Bollinger Bands are also tightening, indicating reduced volatility and a consolidation phase in the near future. The price is also hovering around the middle baseline, indicating a neutral pivot point.
A strong close above the 100 EMA at $0.0945 would strengthen the bull case. However, a failure to hold the support at $0.0925 could result in a retest of the recent low.
Momentum Indicators Point to Improving Bullish Outlook
The Relative Strength Index (RSI) currently sits at 55.22, rising steadily but comfortably above the 50 neutral marks. HBAR has been rising steadily since its sharp recovery from oversold territory on March 23.
This indicates a strong increase in buyer confidence. HBAR still has plenty of room to run before reaching its next resistance.
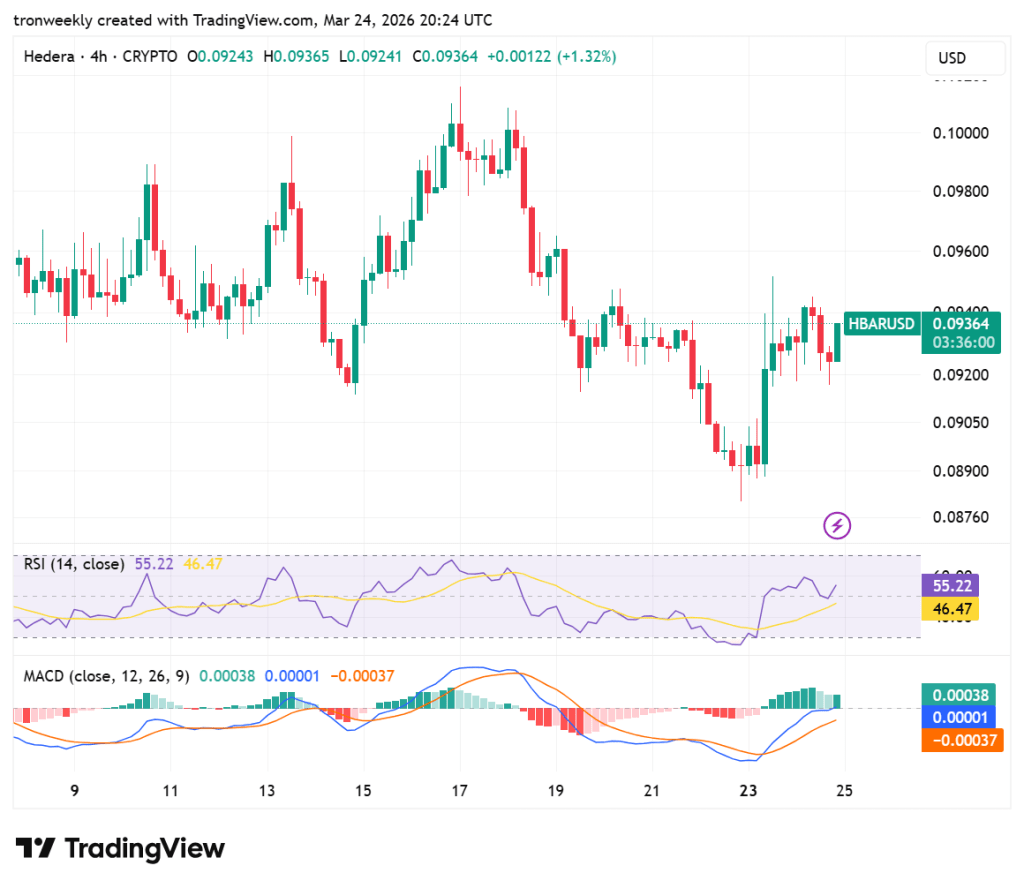
Source: TradingView
In line with this, the MACD also produces an unmistakable bullish crossover as the blue line for the MACD rises above the orange line for the signal. The histogram now turns to positive green, indicating a change in the momentum.
This shows that the selling pressure in the recent trading sessions may be subsiding and may set the stage for price stability and higher psychological levels in the near term.
This article contains market analysis and price predictions. These are not guarantees. Crypto markets are volatile. Always DYOR. Not financial advice.
Also Read: Hedera (HBAR) Price Forecast: Can Price Rally Toward $0.120 Target?

Be the first to comment