


What to know:
- Hyperliquid RWA open interest surges past $2.3B, signaling strong market growth and rising participation.
- HYPE rises 8% on the USDT pair but underperforms BTC, hinting at a weak, liquidation-driven bounce.
- RSI above 61 and bullish MACD crossover suggest momentum still favors potential upside.

Hyperliquid is witnessing a powerful surge in real-world asset (RWA) trading, reaching new all-time highs week after week. The platform’s open interest has now surpassed $2.3 billion, signaling a sharp rise in market activity.
This milestone reflects growing trader confidence and increasing demand for tokenized assets tied to tangible real-world value.

Source: Hyperliquid’s X Post

The rapid growth highlights a broader shift as traders embrace RWAs as a bridge between traditional finance and crypto markets.
Rising open interest suggests deeper liquidity and stronger participation, potentially driven by institutional interest. If momentum continues, Hyperliquid could emerge as a dominant force in RWA derivatives trading and innovation.
Also Read: Hyperliquid (HYPE) Bulls Defend Critical Support as $40 Target Emerges
HYPE Targets $40 Resistance as Momentum Strengthens
Following this on-chain achievement, an increase of 8% was observed for USDT, while it increased just 2% versus BTC.
The crypto analyst Umair Crypto pointed out that this is because the surge is likely due to short-term positions unwinding as opposed to genuine spot buying interest. As such, it may be prone to failure if it does not break the resistance level at $39.4.
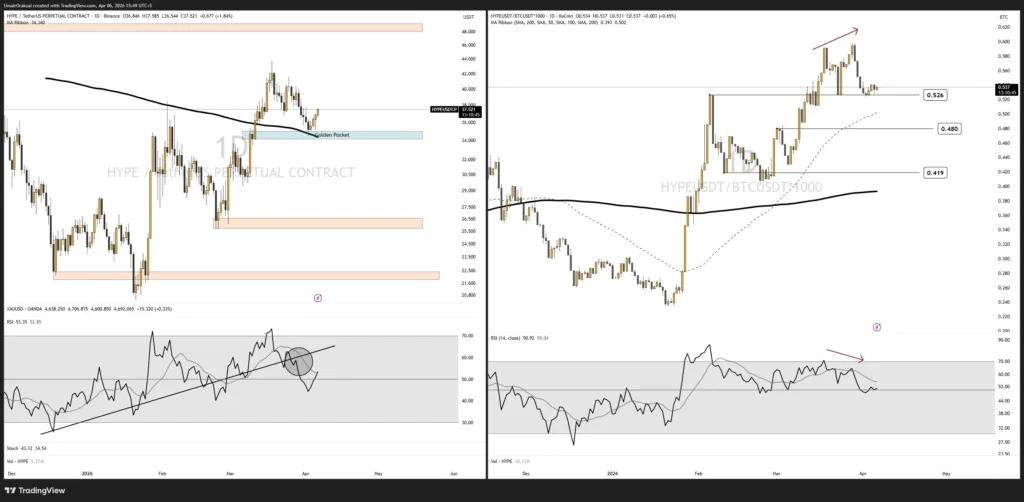
Source: Umair Crypto’s X Post
The situation gets further complicated by a token unlock of $376 million that introduces 2.39% additional supply. Resistance in the range of $40 to $43 looks like a key level here.
Absence of a green signal from the BTC chart, the prevailing bullish story appears to be flimsy, with plenty of room for a potential drop.
Momentum Indicators Support Bullish Recovery Ahead
According to TradingView, the RSI is trading at 61.67, which is an excellent bullish indicator because it is trading well above the 50 line, which is considered neutral.
RSI does not yet have to contend with an overbought market condition, as it is far from the 70 line. Additionally, RSI is holding firmly above its yellow moving average.
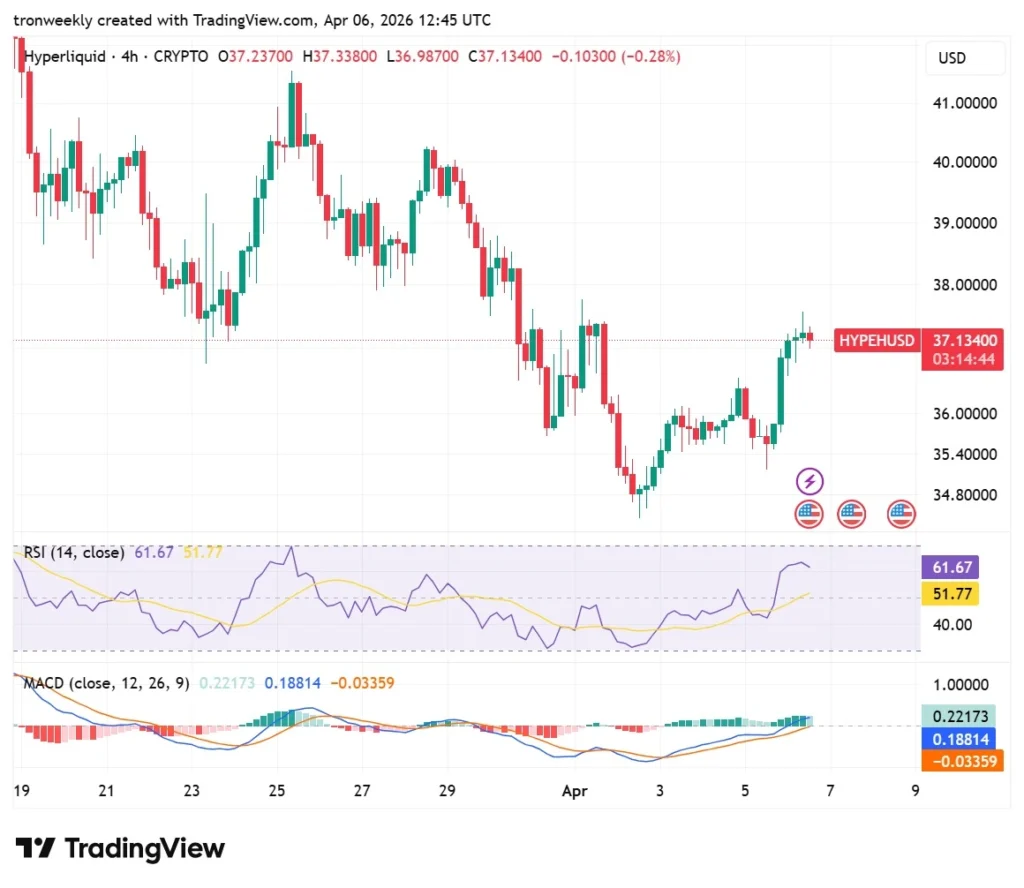
Source: TradingView
The MACD confirms the strength of the momentum through its bullish crossover since the blue MACD line is crossing above the orange signal line.
Furthermore, the histogram bars change color to green and increase in size as well, suggesting an increase in buying pressures. Overall, the signs suggest that the price movement has started to gain strength.
This article contains market analysis and price predictions. These are not guarantees. Crypto markets are volatile. Always DYOR. Not financial advice.
Also Read: HYPE Price Consolidates While Volume Drops Further Target $38.4 Key Level

Be the first to comment