


What to know:
- Hyperliquid (HYPE) confirms bullish breakout as buyers defend the key $41–$42 support zone.
- Technical structure stays bullish with an inverse head and shoulders breakout and higher lows formation.
- RSI near 67 and bullish MACD signal continued upside momentum as long as support remains intact.

Hyperliquid (HYPE) looks to be making an upside move as it has confirmed a bullish breakout formation. Price action is still above a key support region, and momentum oscillators show that bulls are in charge. The trend will continue to move higher as long as prices stay above the breakout zone.
At the time of writing, Hyperliquid (HYPE) is trading at $42.08, showing a 0.17% increase over the last 24 hours. The token has recorded a 24-hour trading volume of $468.85 million, while its total market capitalization stands at $10.77 billion.
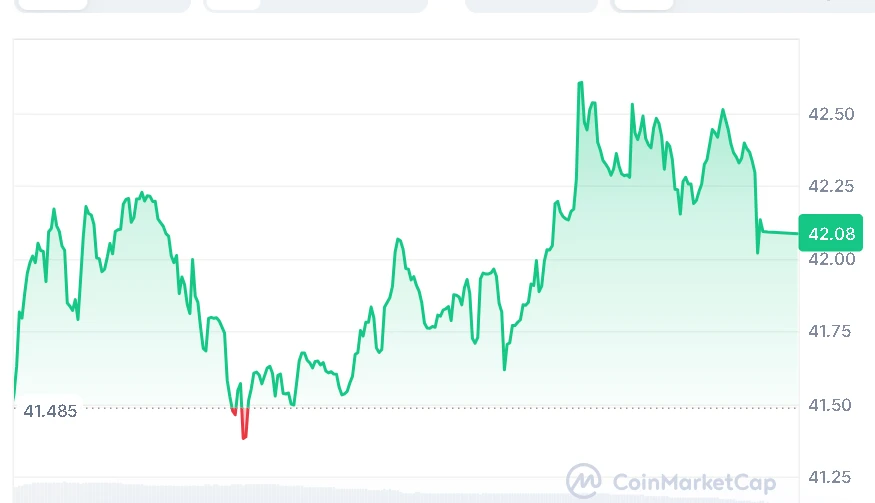

Source: CoinMarketCap

Also Read | Bitwise Hyperliquid ETF Filing Advances After Second SEC Amendment Submission
Hyperliquid (HYPE) Inverse Head and Shoulders Breakout
A crypto analyst, Alpha Crypto Signal, mentioned on April 11, 2026, that there is a very clear inverse head and shoulders breakout that has been established by HYPE. This is because the price had broken an important level of resistance with upward force.


Source: Alpha Crypto Signal’s X Post
Based on the analysis, there are signs of higher lows being formed up to the neckline, after which there is an explosive breakout stage. There have also been increased volumes in this breakout, implying that there is genuine interest in this price movement.
As long as Hyperliquid (HYPE) holds above the breakout area of $41 to $42, the general bias will remain bullish. Retesting this area could still bring in buyers, while any move below it might weaken the existing trade set-up. As of now, the bias leans bullish, and any retracements could be considered opportunities to re-enter the trade.
HYPE Shows Strong Bullish Momentum
Technical signals are also signaling more bullishness ahead. The Relative Strength Index (RSI) stands at 67.12 and remains above the signal line of 53.11, implying that the buying pressure is intact, but the asset is nearing the top end of the momentum band.
The shares of HYPE have also remained trading above their average moving ribbons. At present, the 20-day simple moving average is $38.17, and the 50-day simple moving average is $35.50. However, the 100-day simple moving average stands at $31.70 and the 200-day one stands at $34.07, which is far lower than the prevailing price.

Source: TradingView
On the other hand, the MACD indicator is bullish. This is because the MACD line is now higher than the signal line, with values being 1.07133 and 0.71995, respectively. Furthermore, the histogram has become positive at 0.35138, indicating increased upward momentum.
Overall, from a technical perspective, HYPE remains in good standing because of its sound price structure, as well as momentum indications.
This article contains market analysis and price predictions. These are not guarantees. Crypto markets are volatile. Always DYOR. Not financial advice.
Also Read | Ethereum Gains 2.26% as Key $1,550 and $1,070 Support Zones Come Into Focus

Be the first to comment