


What to know:
- Hyperliquid (HYPE) is consolidating within a symmetrical triangle, signaling a potential breakout ahead.
- Technical indicators reveal a volatility squeeze, with Bollinger Bands narrowing and price compressing between key EMA levels.
- Traders are closely watching the $40 resistance level, where a breakout could confirm bullish continuation for HYPE.

Hyperliquid (HYPE) is currently moving in consolidative price action amid changing conditions in the crypto market. According to CoinMarketCap, the HYPE price over the last 24 hours has declined by 2.93%, while over the last week it has surged by 1.67%.
At the time of writing, HYPE is trading at $38.74 with a trading volume of $122.48 million, which has declined by 35.08% over the last 24 hours. Furthermore, its market capitalization stands at $9.92 billion, which has also dipped by 2.93%.
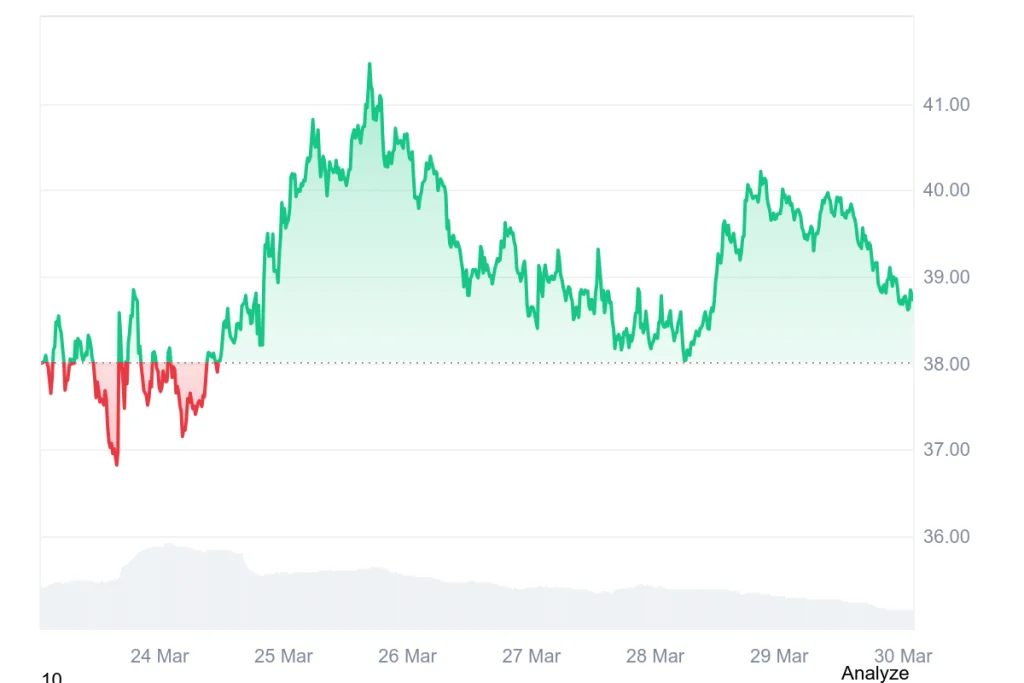
Source: CoinMarketCap

Also Read: Hyperion DeFi Rockets 87% Q4 Profit With Triple-Dip HYPE Strategy
HYPE Price Stalls in Triangle Pattern Before Key Breakout
However, the crypto analyst Alpha Crypto Signal pointed out that the price action of HYPE is compressing inside a symmetrical triangle, with lower highs and higher lows tightening toward the apex.
Volatility continues to decline, signaling that a major breakout move is building beneath the surface as market equilibrium holds and traders await directional expansion in coming sessions.
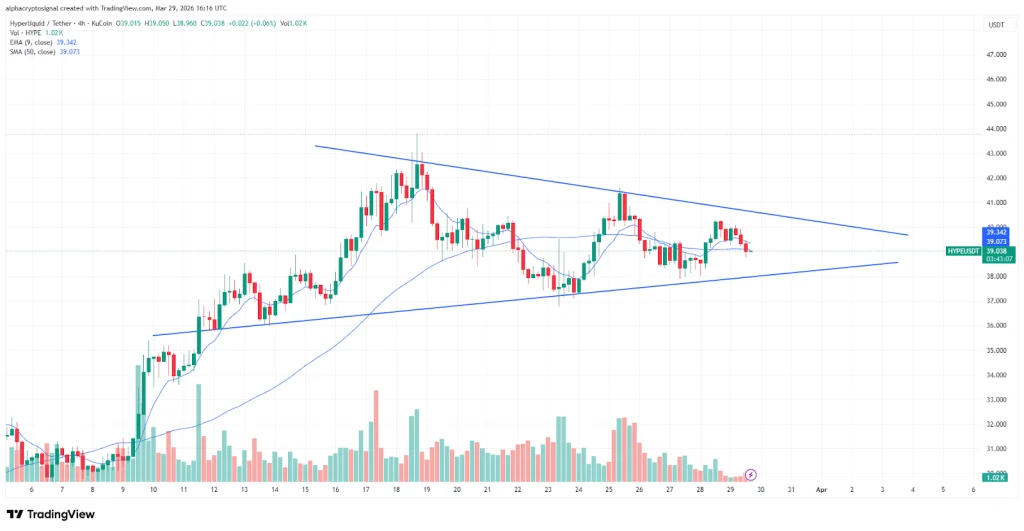
Source: Alpha Crypto Signal’s X Post
For HYPE, traders are looking for a confirmation of a breakout. A steady rise above the resistance at $40 will confirm a bullish continuation.
On the other hand, a fall through the support will shift sentiment to a bearish view, negating the current structure. Until then, the asset remains in consolidation, and the compression of volatility suggests that the upcoming expansion phase is almost over.
HYPE Technical Outlook Points to a Consolidation Phase
According to TradingView, the HYPE price action has moved from a vertical and steep uptrend to a consolidation phase. After rallying to a high near $43.00, it found resistance and declined back to its current price around $38.74.
This is a move below its 20-period EMA and 50-period EMA, indicating bearish pressure in the near term as it attempts to find its ground above its 200-period EMA support.
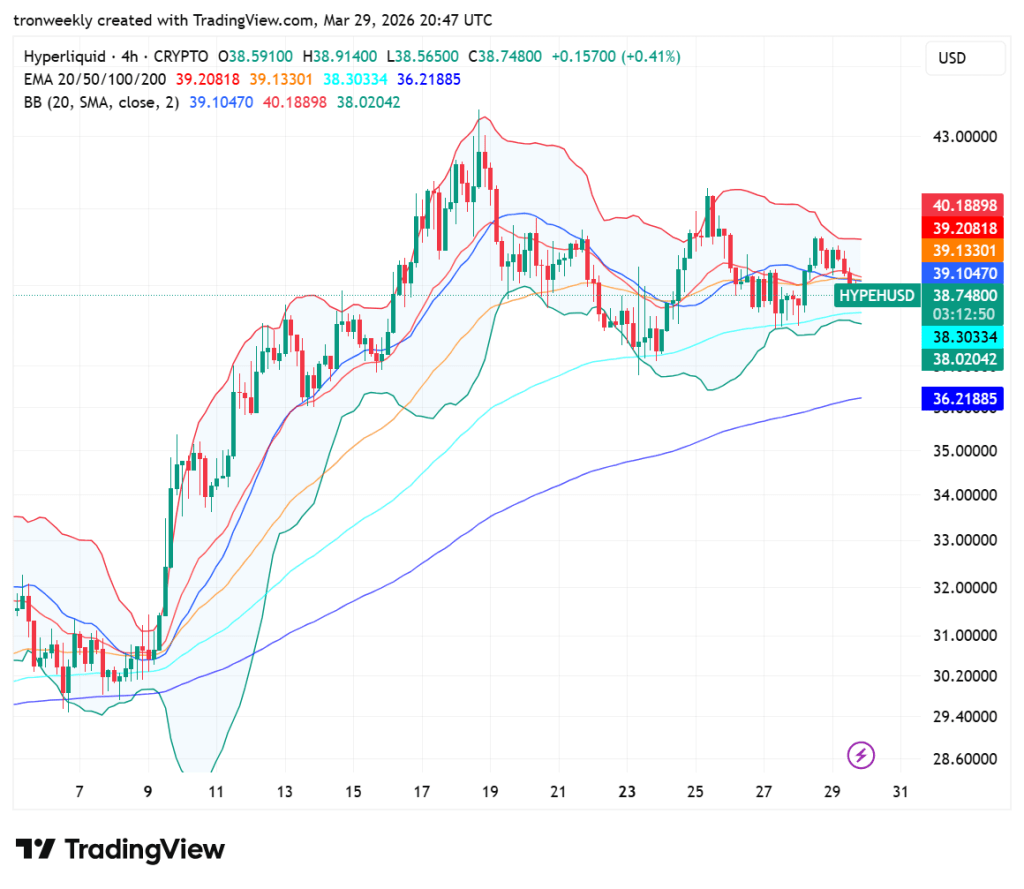
Source: TradingView
From a technical analysis perspective, there are hints of a calm before a storm, as suggested by the Bollinger Bands, which have recently been squeezed significantly.
The asset is being contained within a tight range by both the 100-period EMA at $38.30 and the asset’s midline at $39.10. A break above the upper band at $40.18 or a fall through $36.21 could indicate the direction of the asset’s next trend.
This article contains market analysis and price predictions. These are not guarantees. Crypto markets are volatile. Always DYOR. Not financial advice.
Also Read: Hyperliquid (HYPE) Shows Strength: Will $43.7 Unlock Next Rally?
Be the first to comment