


What to know:
- IOTA holds near channel support as selling pressure weakens and buyers slowly step in.
- Rising trading volume near support signals growing interest, with upside targets at $0.080, $0.100, and $0.120 if buying continues.
- RSI near 38 and MACD in negative territory indicate weak momentum and ongoing consolidation.


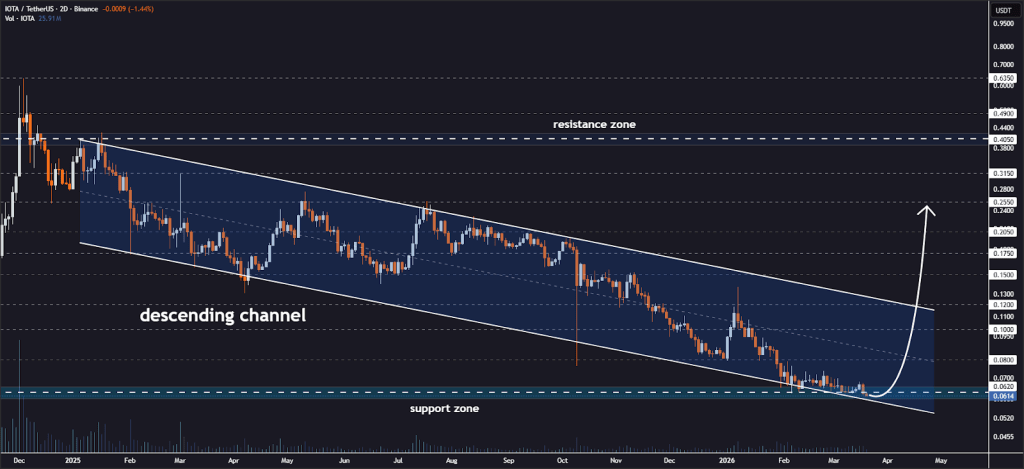
IOTA is stabilizing near the lower boundary of a descending channel on the 2-day timeframe on Saturday, March 21, indicating a potential shift in market sentiment.
According to the crypto analyst Jonathan Carter, this technical zone is acting as a strong support area, where selling pressure is gradually weakening and buyers are beginning to step in, helping the token consolidate and prepare for a possible upward move.

Source: Jonathan Carter’s X Post
Rising trading volume around the support level suggests growing investor interest and improving momentum in the market.
If buying pressure continues to build, IOTA could move toward key resistance targets at $0.080, $0.100, and $0.120, with extended bullish levels at $0.150, $0.175, $0.205, and $0.255 in the coming sessions.
Also Read: IOTA Price Outlook: $0.0699 Short-Term TARGET After Support Hold
IOTA Faces Pressure Below all Moving Averages
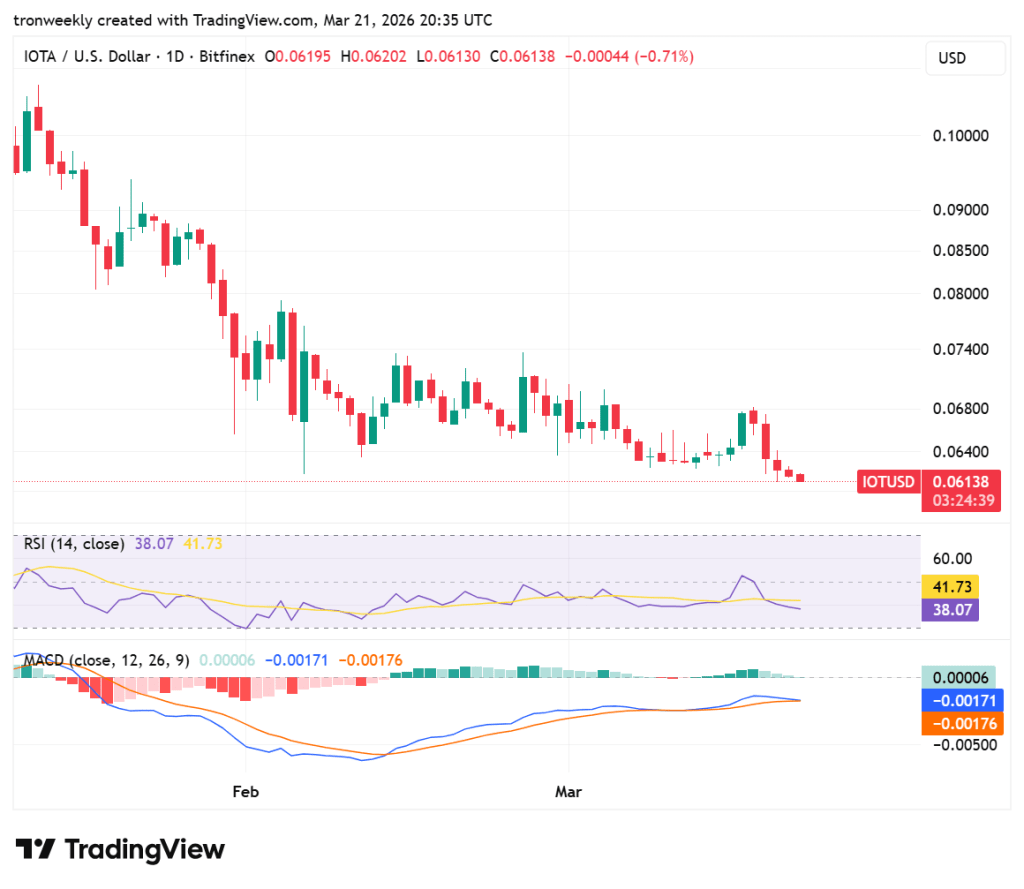
As per the TradingView chart, IOTA has a bearish structure, as the price is being suppressed below all the primary exponential moving averages.
The current price of IOTA is $0.06138, which is unable to move above the 20-day exponential moving average, which is located at $0.06456. The immediate support for the price of IOTA lies at the lower Bollinger band, which is located at $0.06055.

Source: TradingView
The technical indicators point to a narrowing volatility range, as the Bollinger Bands start to squeeze. The large price gap between the current price and the 200-day EMA, which is trading at $0.10842, indicates an oversold position from a long-term point of view.
However, until a price breakout occurs above the 50-day EMA, which is trading at $0.06984, the price momentum will be strongly weighted to the downside.
Momentum Indicators Point to Downward Pressure
The relative strength index (RSI) is at a current value of 38.07. This puts the asset firmly in a zone where it can be classified as both bearish and neutral.
Since it’s above the oversold zone of 30, there’s still room for it to fall before it gets exhausted. The RSI line remains in position below the signal line, which indicates a lack of upward momentum.
Source: TradingView
The MACD lines are flat and have converged at a low point, with their values at -0.00171. The close proximity between the blue MACD line and the orange line is a result of low volatility. Although there is a small tick in the histogram, it is still a small green tick. The trend is still quite weak.
This article contains market analysis and price predictions. These are not guarantees. Crypto markets are volatile. Always DYOR. Not financial advice.
Also Read: IOTA Rockets Toward $1.26 as Bullish Exchange Listing Sparks Optimism

Be the first to comment