


What to know:
- FARTCOIN approaches $0.22 resistance as momentum slows after a strong weekly rally.
- Analysts watch the $0.18–$0.14 support zone if the price fails to break above resistance.
- RSI and MACD signal rising momentum, but trend strength still lacks confirmation.


FARTCOIN has continued its recent uptrend into the key resistance zone, with the price action now showing signs of slowing down. The uptrend is the result of the strong performance recorded in the market during the past week.
As of press time, FARTCOIN is currently trading at $0.2109, with a gain of 0.29% in the last 24 hours. The trading volume is standing at $94.05 million, a drop of 0.16%. Over the last seven days, the coin has recorded a gain of 36.33%.


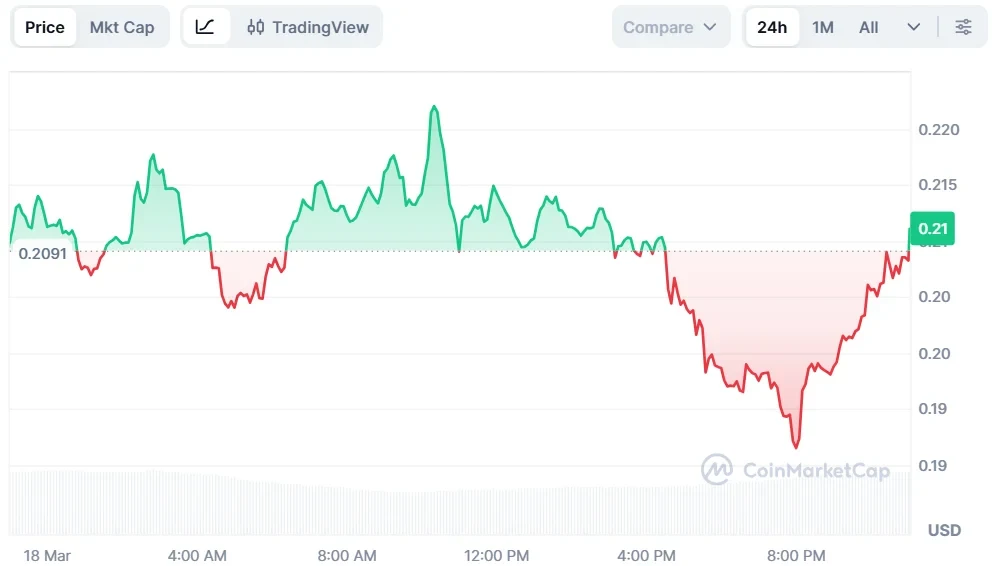
Source: CoinMarketCap
FARTCOIN Hits Supply Zone, Momentum Weakens
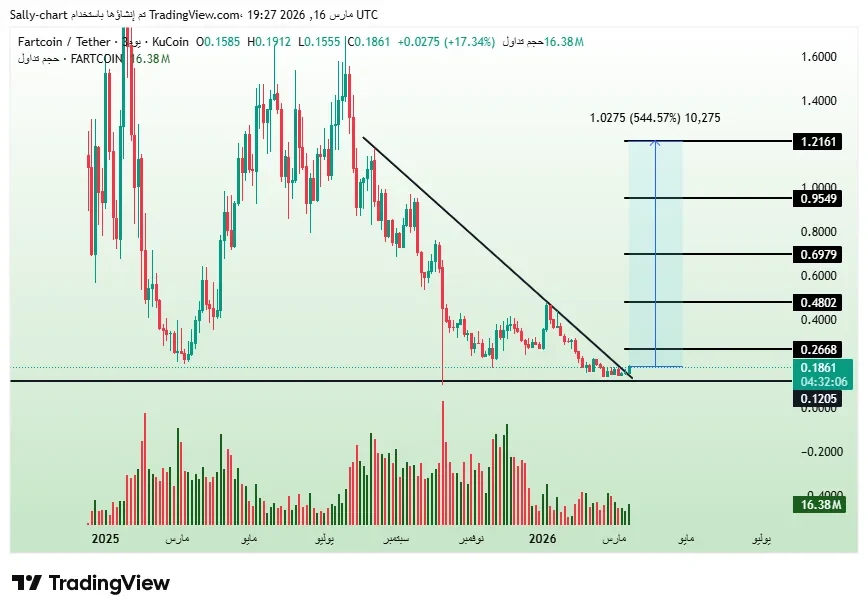
Analyst Cryptorphic highlighted that FARTCOIN has entered a major resistance area between $0.22 and $0.23. He explained that the strength of the rise in this area is weakening. Rapid upward moves into supply zones often lead to consolidation phases. This pattern has appeared across multiple time frames.
If the price fails to break above this resistance, a pullback may occur. The range of $0.18 to $0.14 is being monitored as a possible support area. The consensus is that the risk is still skewed to the downside as long as the price is below the resistance.


Source: X
Additionally, another analyst, Crypto Hunter Arab, mentioned another technical setup. The analyst described the structure as downtrend compression. This pattern is likely to occur before the breakout occurs. However, confirmation is required before any directional move becomes clear.

Source: X
Also Read: AAVE Eyes 20% Surge Amid Bearish Pressure
Derivatives Data Shows Mixed Market Signals
According to CoinGlass data, Open Interest increased by 0.93% to $161.95 million. This indicates rising participation from traders. However, the trading volume decreased by 8.10% to $628.75 million. The OI-weighted funding rate is at 0.0090%, showing a slight bullish bias.
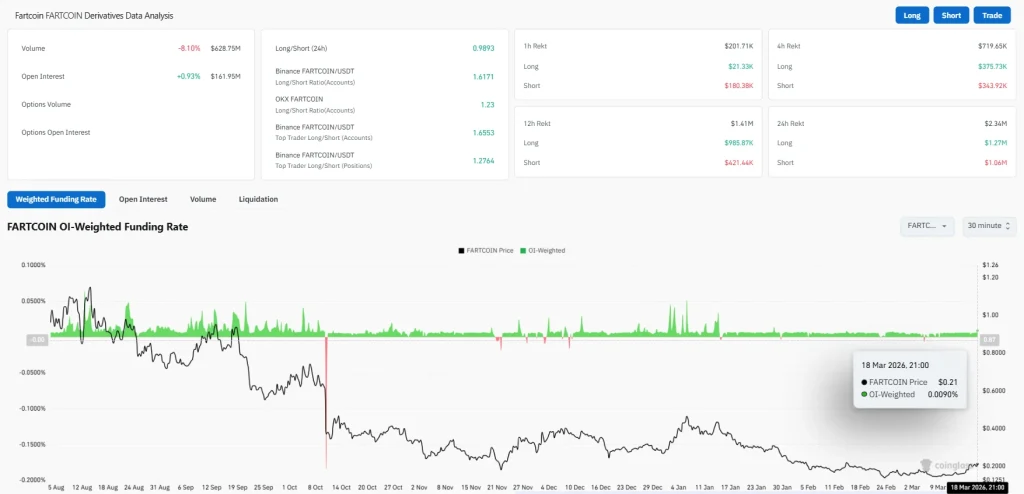
Source: CoinGlass
Momentum Builds as RSI Rises, MACD Turns Bullish
The Relative Strength Index (RSI) is at 65.47, and the RSI moving average is at 46.21. These values show that the momentum is rising, but it is not too high. This indicates that the buying activity has increased during the recent price move.
The Moving Average Convergence Divergence (MACD) indicator shows that the early signals are bullish. The MACD line is at 0.00149, the signal line is at -0.00774, and the histogram is at 0.00922. These values show that the rising trend is moderate, but it is not a strong trend confirmation.
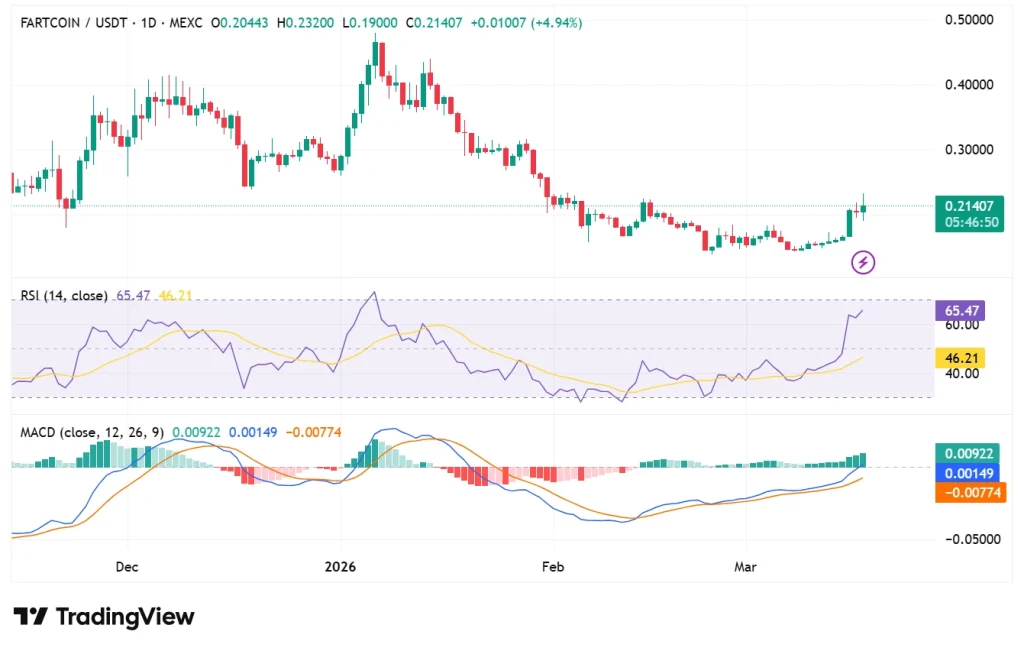
Source: TradingView
This article contains market analysis and price predictions. These are not guarantees. Crypto markets are volatile. Always DYOR. Not financial advice.
Also Read: FARTCOIN Stabilizes After Major Drop; $0.30 Target in Focus

Be the first to comment