


What to know:
- BNB price stabilizes near support as traders watch for the next directional move.
- Rebound from $570 support puts focus on $620 and $650 resistance levels.
- Weak momentum persists as RSI and MACD indicate ongoing bearish pressure.

Binance Coin (BNB) price appears to be stabilizing after experiencing losses recently. The market sentiment remains cautious as the traders wait for further moves. The price structure will now depend on whether the support levels hold strong.
BNB price is trading at $587.87, marking a 2.49% increase in a day. The trading volume is down by 35.37% and is currently standing at $1.42 billion. Over the last week, the BNB price has decreased by 10.77%, according to CoinMarketCap.
Also Read: BNB Price Analysis: $600 Support Holds as $640 Resistance Limits Upside

BNB Price Bounce Signals Possible Trend Shift
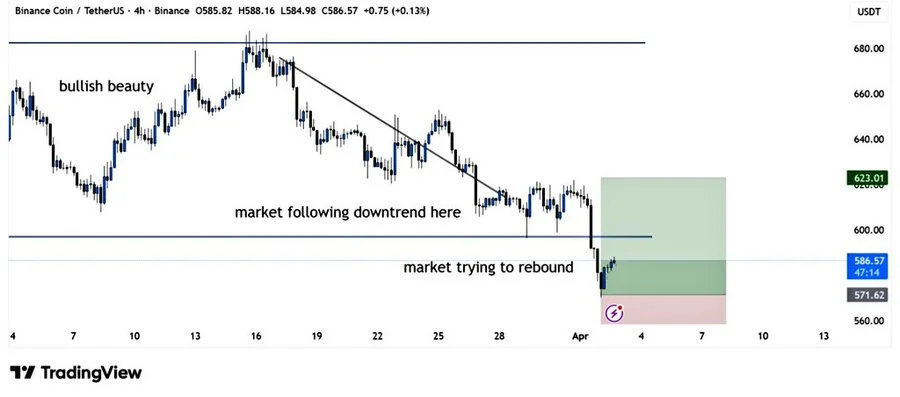
Analyst BitGuru highlighted that BNB is making an attempt at a reversal following its previous steep decline. It rebounded from the support zone at $570.
The support zone currently serves as an essential base for the price activity. If it manages to remain above this area, it will help facilitate an advance towards $620. Conversely, breaking below the $570 level will resume the downward trend.
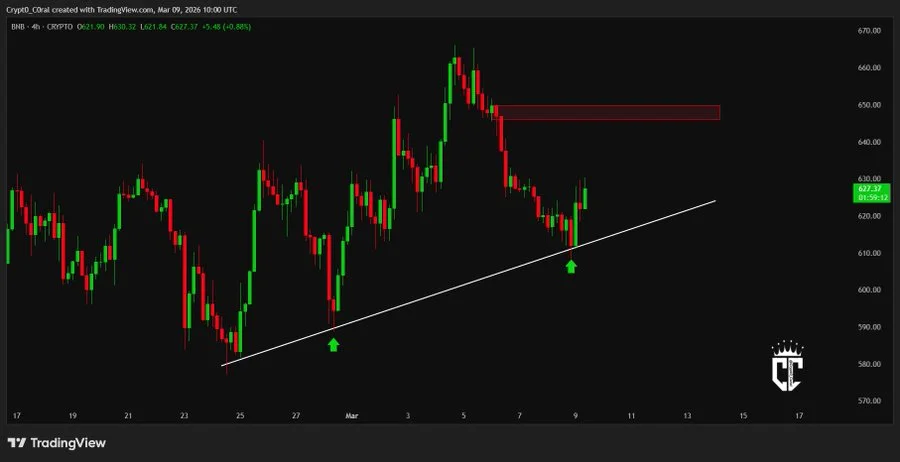
Moreover, another analyst, Crypto Coral, mentioned that BNB still maintains an ascending trend line. The trend line is significant in supporting the ongoing rally.
Bouncing off the trend line would take the price to the resistance level between $645 and $650. These levels remain important for confirming any stronger upward move.
Futures Volume Drops as Open Interest Declines
CoinGlass data shows that future volume reduced by 42.01% to $692.94 million. The open interest has gone down by 2.28% to $946.42 million. The OI-weighted funding rate is 0.0004%, indicating a relatively balanced market without any notable direction.
Liquidation data shows limited market stress. The total liquidations amounted to $172,870 in the past 24 hours. The long side has $103,530 of liquidations. Meanwhile, the short side saw $69,350 in liquidations.
RSI and MACD Highlight Continued Downtrend
The Relative Strength Index (RSI) is at 34.68 and below the neutral level of 50. This indicates that there is little market momentum. Its moving average is at 41.54. RSI shows that buying strength has yet to make a full comeback.
Moving Average Convergence Divergence (MACD) continues to remain in negative territory. The MACD line is -13.76, while the signal line stands at -9.36. The histogram level stands at -4.40. It shows that the bearish momentum continues to prevail.
The BNB price is still at an important level. The price is supported by $570, while the resistance is seen around $620 and $650. Traders continue to monitor these levels closely.
This article contains market analysis and price predictions. These are not guarantees. Crypto markets are volatile. Always DYOR. Not financial advice.
Also Read: Hyperliquid (HYPE) Bulls Defend Critical Support as $40 Target Emerges

Be the first to comment