


What to know:
- OP faces a critical accumulation zone at $0.075–$0.13, signaling early demand absorption.
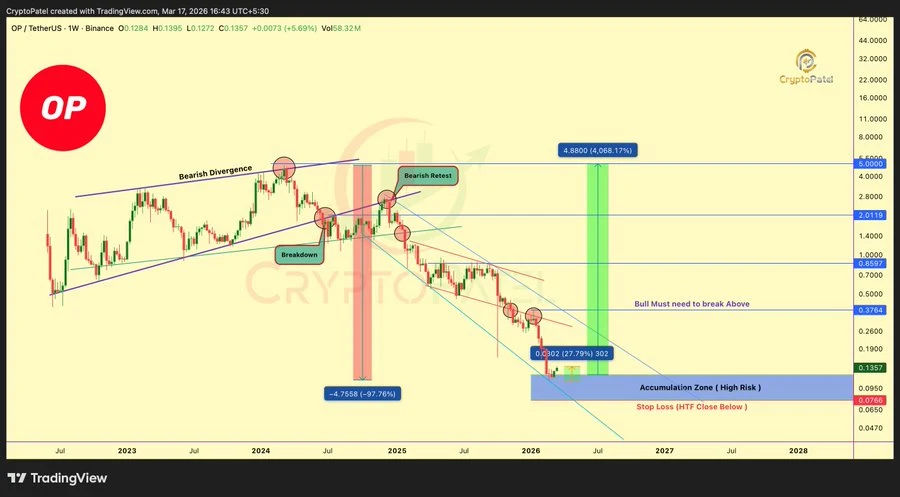
- Weekly close above $0.3764 required for bullish confirmation; below $0.075 invalidates setup.
- Price shows cautious recovery, but the trend remains bearish until a structural breakout occurs.


Optimism (OP) is showing signs of early accumulation after a prolonged downtrend. Analyst Crypto Patel estimates that Optimism may rise to as much as 40x its current value if market conditions are favorable. The weekly chart indicates a large fall in value by as much as 97.76%.
The token is currently testing a major demand zone ranging from $0.075 to $0.13. This is an area where the token’s value has consolidated in the past. This may be an indication that long-term buyers are coming in.

This decline came after a big top formation following a strong price increase. Also, Optimism had higher highs while its momentum indicators were slowing down, indicating that buyers were exhausted.

Source: X
When the price broke through the rising support trend line, this indicated a shift of power from buyers to sellers.
When attempts were made to go up again, these levels, which were formerly support, became resistance, leading to a continuous downtrend characterized by lower highs and lower lows.
Also Read: Optimism (OP) Price Eyes 4000% Rally As Accumulation Zone Forms
Optimism Trapped in Descending Channel With Key Weekly Levels
Optimism is currently stuck in a price channel that is trending downwards from its all-time high of $5. The volatility is also getting tighter, and a move could occur.
To confirm a bullish reversal, a strong weekly close above $0.3764 is needed. If it happens, targets go as high as $0.37, then $0.85, $2, and finally, the OP is back at $5.
If the weekly close is below $0.075, the idea of accumulation is broken, and a further fall is possible as the trapped buyers sell their shares.
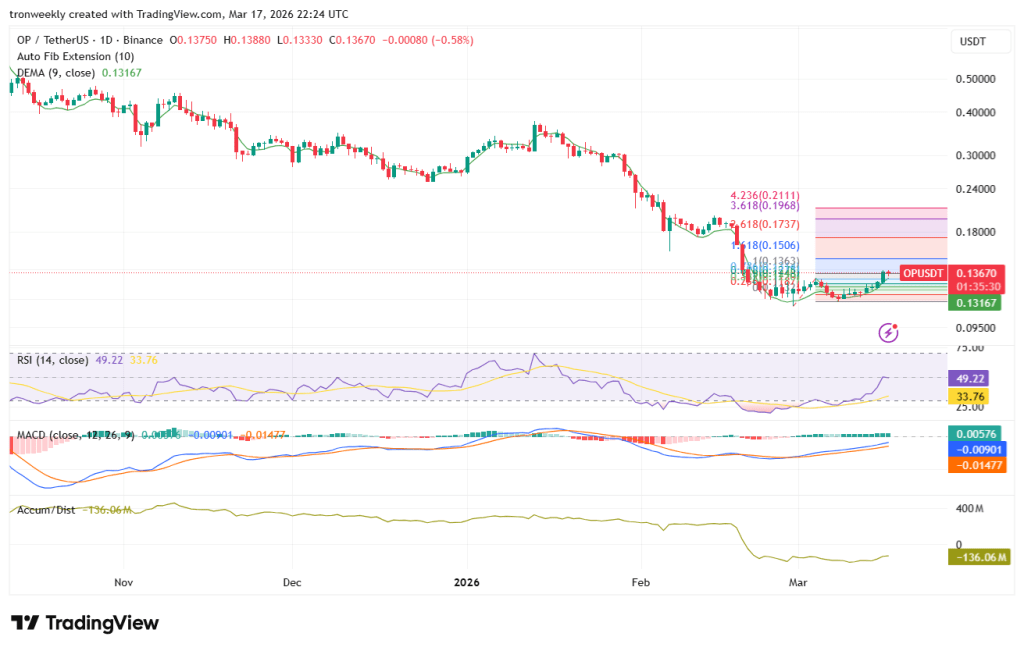
From the daily chart on TradingView, the price is trading just above recent lows, and the nearest support is the 0.12-0.13 region.
The recent bounce is slowing down near the 0.618 Fibonacci retracement level, indicating selling pressure is present at key levels. The 9-day EMA is slightly above the current price level and is flattening as the bears lose steam.

Source: TradingView
Momentum and Potential Trend Transition
The momentum indicators on the TradingView platform are showing cautious optimism but have yet to give a full bullish confirmation.
The RSI has moved up from the oversold zone and is heading towards the center line. This is showing improved buying pressure. The MACD is also heading for a bullish crossover.
Source: TradingView
The histogram bars are also increasing, showing the bearish momentum weakening. The Accumulation/Distribution Index is still low, meaning there is no large-scale buying.
This article contains market analysis and price predictions. These are not guarantees. Crypto markets are volatile. Always DYOR. Not financial advice.
Also Read: Optimism (OP) Holds Key Support and Eyes a Potential Rally Toward $2.50

Be the first to comment