


What to know:
- Litecoin (LTC) shows early bullish recovery as price stabilizes around $54–$55 after recent market volatility.
- Technical indicators such as RSI near 58 suggest strengthening momentum, while MACD shows consolidation.
- LTC is forming higher lows, indicating gradual bullish structure despite strong resistance between $55 and $56.

Litecoin (LTC) is moving in a bearish to bullish phase with the general market trend turning from bearish to bullish. According to CoinMarketCap, the LTC price has remained stable over the last 24 hours but remains 5.33% up over the last week.
At the time of writing, LTC is trading at $54.73, with a trading volume of $218.21 million, which has declined by 28.42% over the last 24 hours. However, its market capitalization stands at $4.21 billion, which is stable.
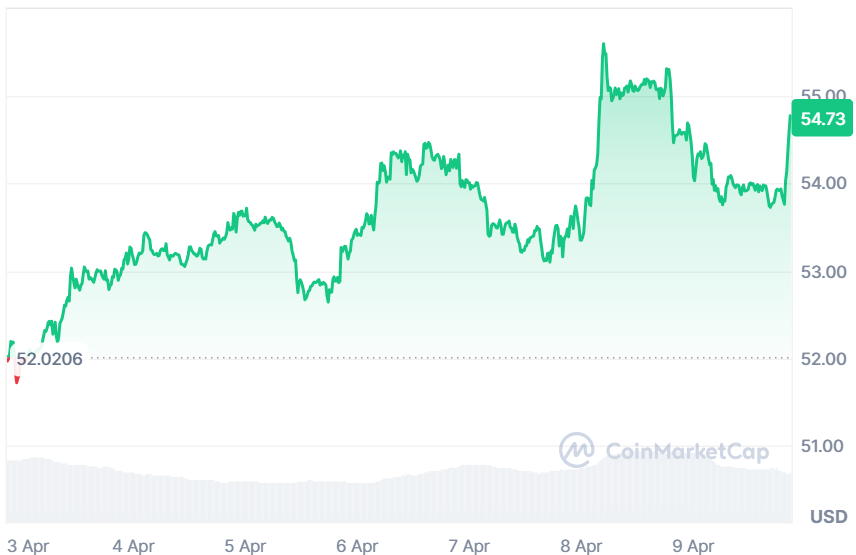
Source: CoinMarketCap

Also Read: Litecoin (LTC) at $53: 5 Powerful Signals Point to a $60 Breakout
Litecoin (LTC) Targets $1000 After Four Years of Patience
Furthermore, the crypto analyst Crypto Patel highlighted that Litecoin holders have endured extended consolidation over the past four years, marked by weak sentiment and long periods of sideways trading.
Despite limited excitement, the community often refers to this phase as “four years of patience,” believing long market cycles typically precede major expansions. Conviction among long-term Litecoin supporters has remained steady.
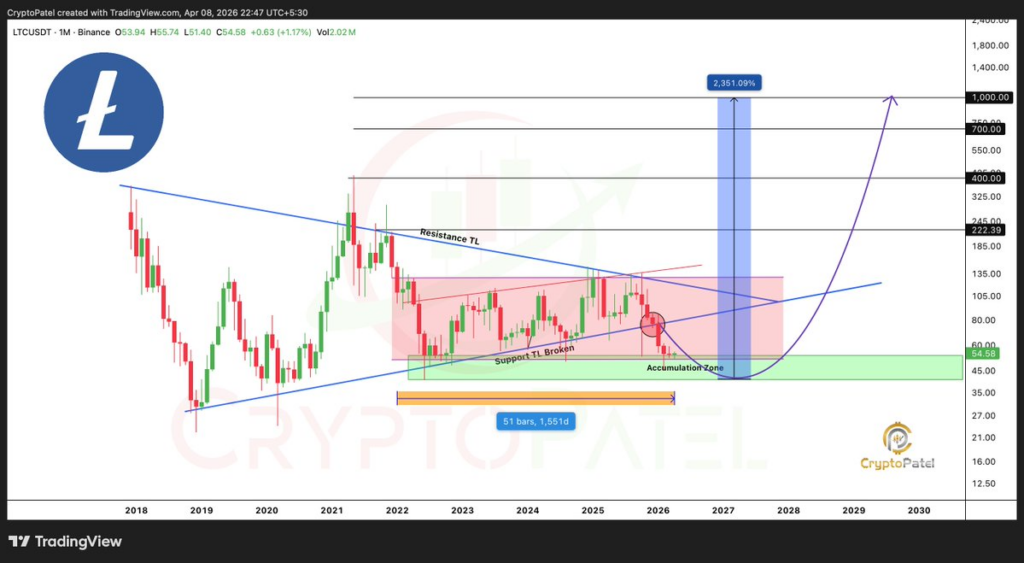
Source: Crypto Patel’s X Post
However, optimism seems to be returning in light of what could become a big breakout due to macro cycles within cryptocurrencies and halving trends.
Although the goal of hitting $1,000 is still very much uncertain, it indicates that emotions around Litecoin have shifted from uncertainty towards confidence. Investors have started to believe that the buildup to such an event has been long overdue.
Litecoin (LTC) Technical Outlook Shows Recovery Phase
According to TradingView, the recovery is evident in the price movements of LTC following a steep fall down to $51.80 around early April.
The current price movement pattern in LTC indicates that there are higher lows occurring at $54.78. Although the overall trend is bullish, resistance remains intact from $55.00 to $56.00.
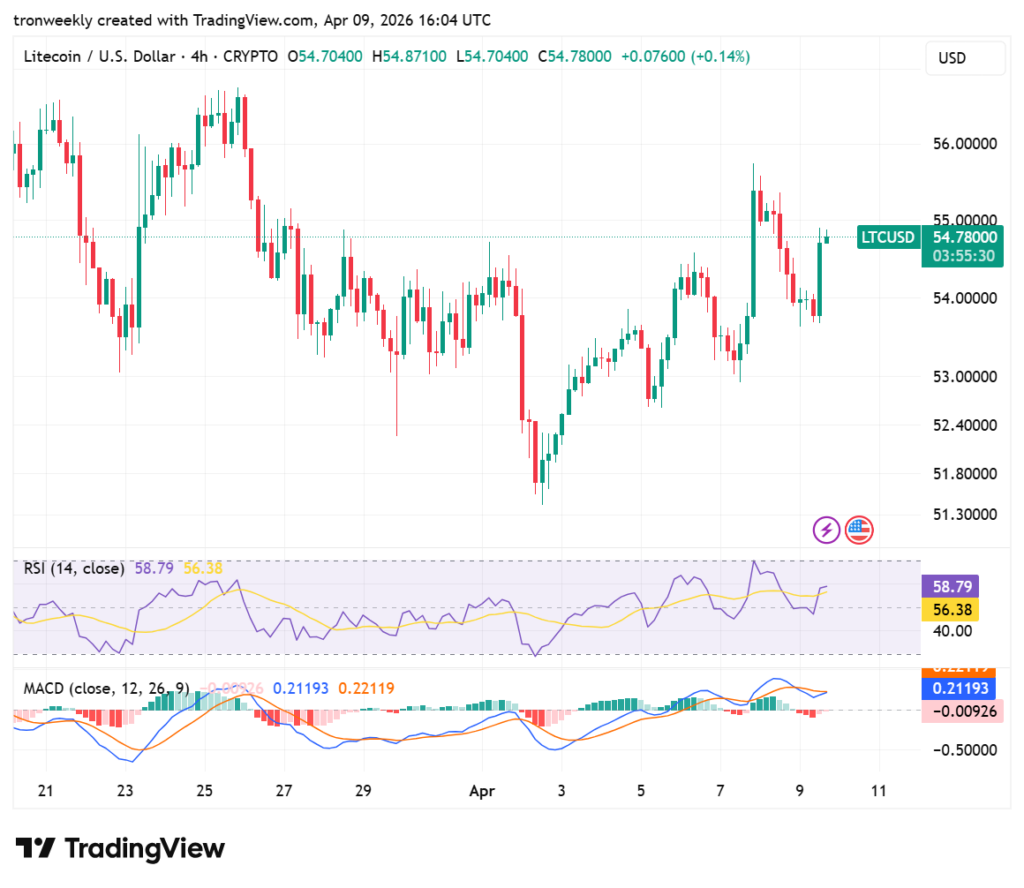
Source: TradingView
The technical indicators exhibit a conservative bullish attitude. With the RSI at 58.79, it shows that the price is gaining strength but is not overbought yet.
The MACD lines, on the other hand, are moving sideways around the zero line, implying that the price action is slowing down temporarily from its upward direction.
This article contains market analysis and price predictions. These are not guarantees. Crypto markets are volatile. Always DYOR. Not financial advice.
Also Read: Litecoin Price Prediction Signals Breakout as LTC Holds Key Support

Be the first to comment