


What to know:
- MANTA shows a falling wedge pattern, indicating a possible bullish reversal in the crypto market.
- Analysts predict a breakout could drive MANTA’s price toward $0.35, sparking investor optimism.
- RSI at 49.99 and a narrowing MACD suggest neutral momentum with fading upward pressure.


MANTA is drawing attention as it forms a falling wedge pattern, a well-known bullish reversal signal in technical analysis.
According to the crypto analyst Captain Faibik, traders anticipate that a successful breakout from this pattern could ignite upward momentum, potentially driving the token’s price higher. Captain Faibik is closely watching market behavior as momentum builds toward a key resistance level.


Source: Captain Faibik’s X Post
A breakout could push MANTA toward the $0.35 mark, reflecting growing optimism among investors. While technical setups are promising, experts caution that the crypto market remains volatile and unpredictable.
Combining chart analysis with broader market insights is essential. Still, $MANTA’s potential movement makes it an intriguing token for both short-term traders seeking quick gains and long-term enthusiasts.
Also Read: MANTA Faces Critical Support Test Amid Downtrending Triangle Pattern
MANTA Technical Outlook Reveals Cautious Optimism
According to TradingView, MANTA has a clear bearish trend, with price resolutely holding below the 200 EMA at $0.081.
The wall of resistance remains firm around the 50 EMA at $0.071, as seen in the failed attempts by the price to rebound around this region. Sellers are in charge of the trend as the price continues to fight for a solid bottom.
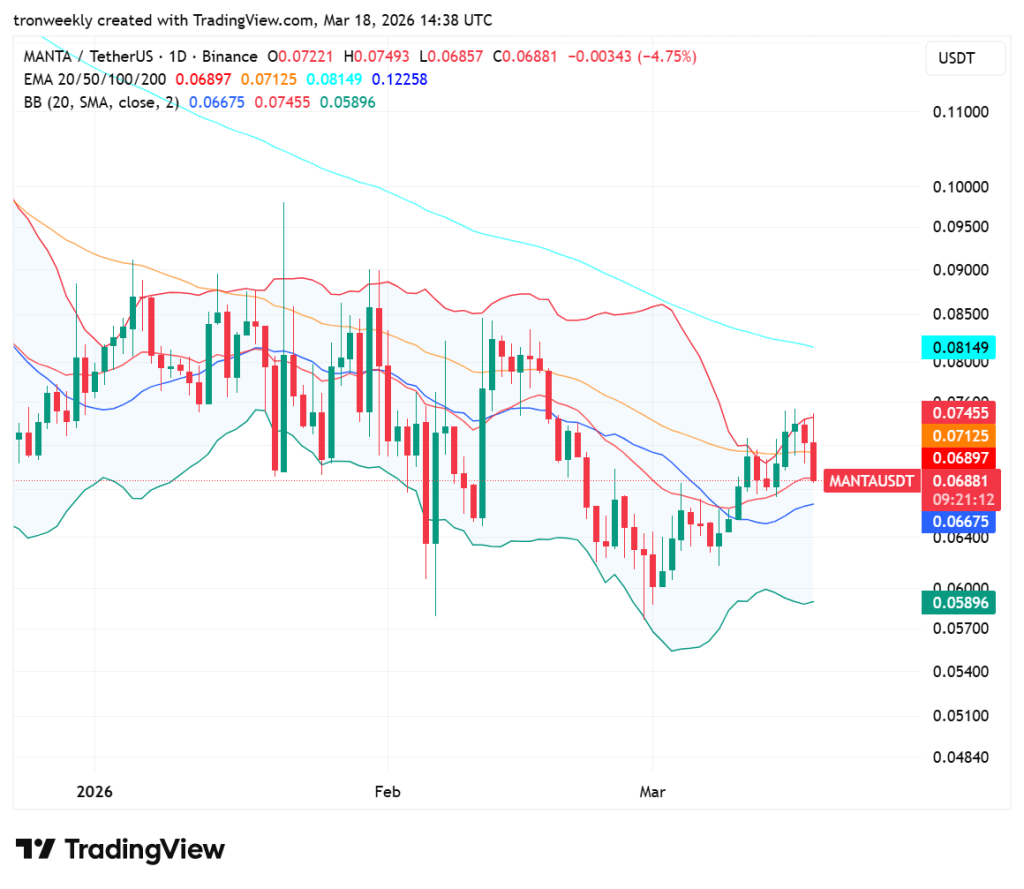
Source: TradingView
The current volatility seems to be moving between the middle and upper Bollinger Bands, resolutely resisting the $0.074 price level.
The momentum is neutral to bearish as the price falls back towards the support zone at $0.066. If this level cannot be maintained, the price may retest the lower band at $0.058.
Momentum Indicators Show Cooling-Off Period
The Relative Strength Index stands at 49.99, which suggests that MANTA is indeed in a neutral momentum phase. The RSI line drops below its average as the price no longer holds above the 60 level.
This suggests that the momentum from the previous price action is decaying as the RSI line moves towards the midpoint at 50.
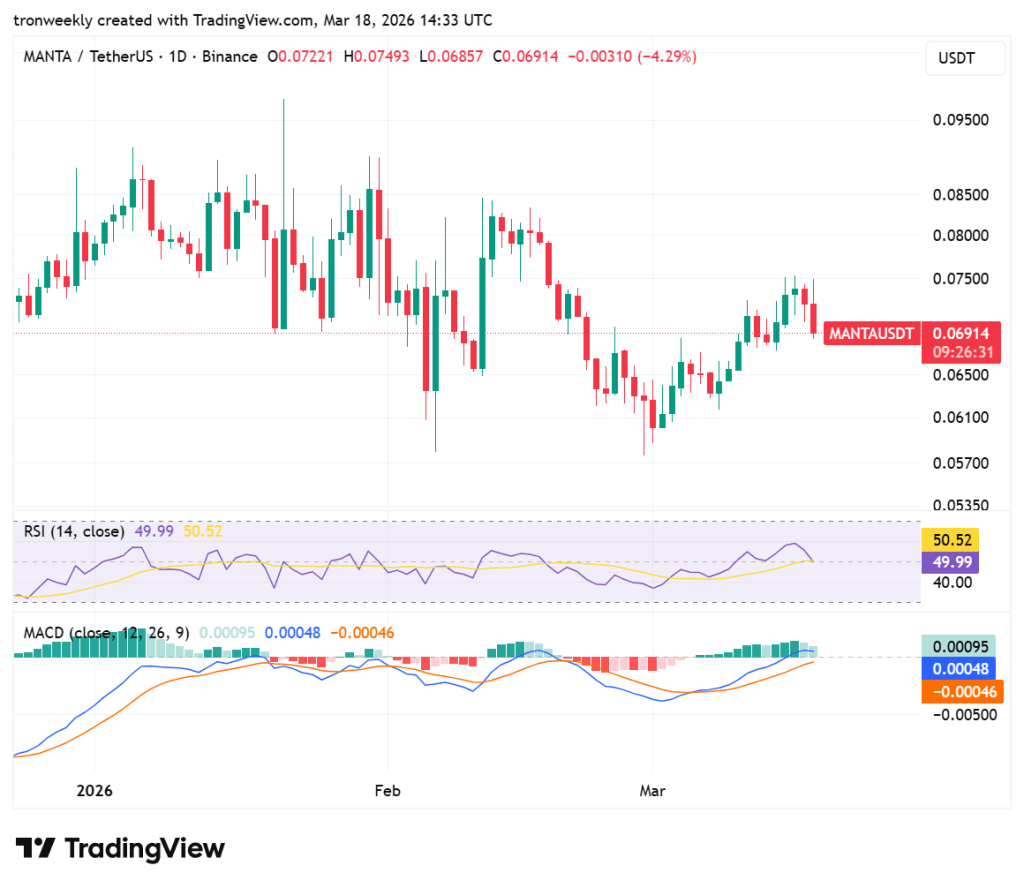
Source: TradingView
The MACD still remains just a tad above the zero line at 0.00048, but the histogram also speaks of fatigue. The MACD line remains above the signal line, but the gap between the two lines is rapidly narrowing down.
This speaks of the loss of upward momentum. If the price continues to turn away from the highs near the resistance level, then the bearish crossover could be just round the corner.
This article contains market analysis and price predictions. These are not guarantees. Crypto markets are volatile. Always DYOR. Not financial advice.
Also Read: MANTA Falling Wedge Pattern Suggests Potential Breakout Toward $0.56

Be the first to comment