


What to know:
- The NEAR Protocol price surged over 19%, signaling strong bullish momentum as the crypto market shows early recovery signs.
- Key support at $1.31–$1.32 could act as a launchpad for a potential rally toward the $1.40–$1.42 resistance zone.
- Technical indicators like RSI (62.81) highlight sustained buying pressure without entering overbought territory.

NEAR Protocol (NEAR) is moving in an upward consolidation phase following early signs of bullishness in the crypto market. According to CoinMarketCap, the NEAR price has surged by 2.84% over the last 24 hours and 19.13% over the last week.
At the time of writing, the token is trading at $1.38, with a trading volume of $257.0 million, which is down by 19.41% over the last 24 hours. However, its market capitalization stands at $1.78 billion, which is up by 2.85%.
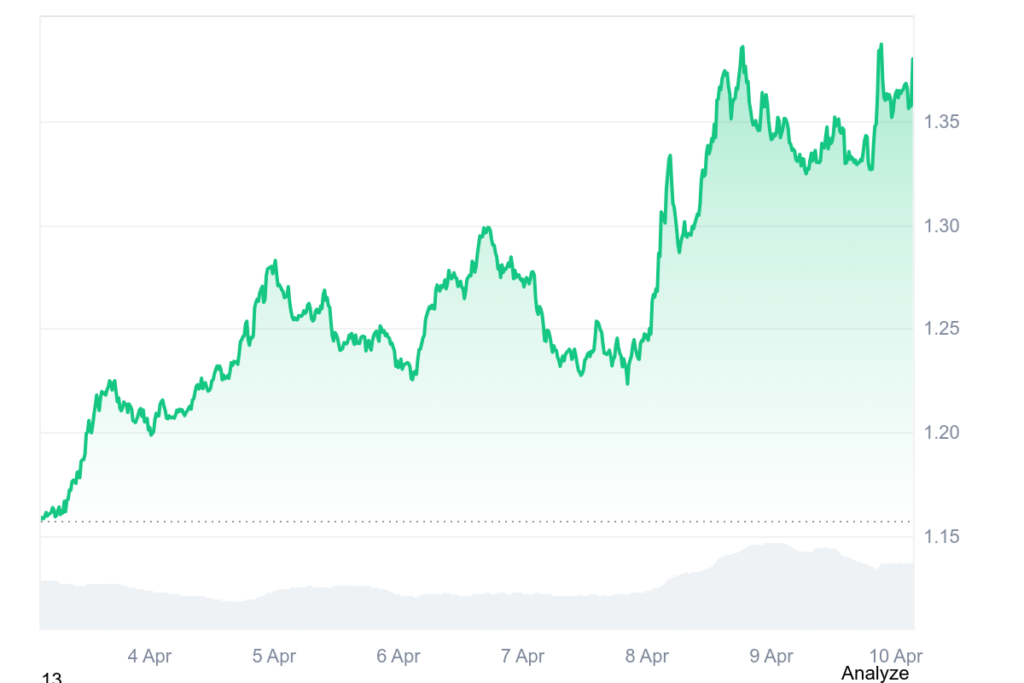
Source: CoinMarketCap

Also Read: NEAR Protocol Price Stalls at $1.26 as Breakout Level Could Unlock $1.35 Rally
NEAR Support at $1.31 Could Trigger Rally Toward $1.42
Furthermore, the crypto analyst Crypto Tony revealed that the token is trading at a crucial technical zone, with market attention focused on the $1.31–$1.32 area as a potential support base.
Traders are watching for signs of stabilization and accumulation, suggesting selling pressure may be fading and the asset could be preparing for a short-term equilibrium.
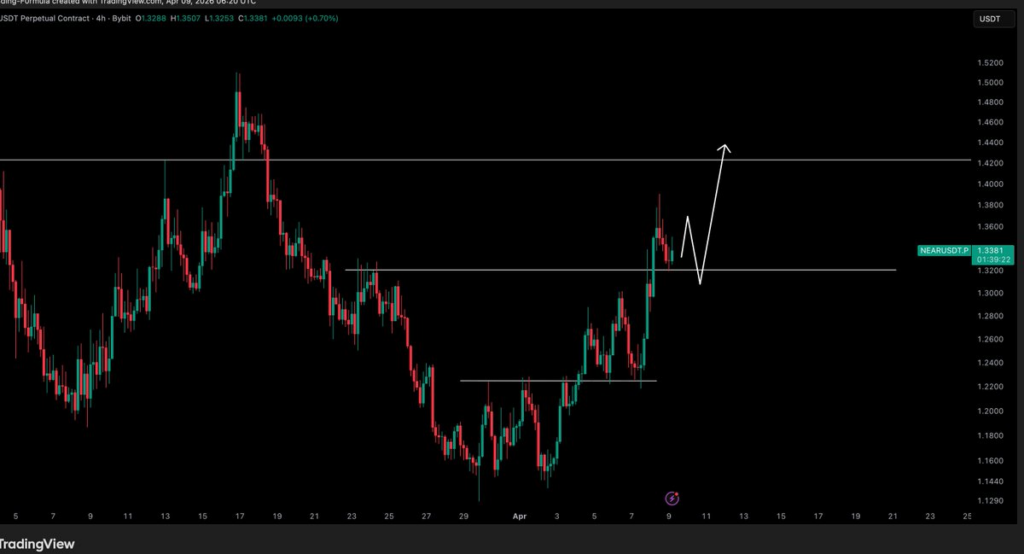
Source: Crypto Tony’s X Post
If NEAR manages to generate enough positive momentum in this particular region, there is likely to be a rise towards the $1.40-$1.42 resistance range.
This is because the $1.40-$1.42 resistance level is the next major upside level for NEAR. It is important that the base is confirmed before any further movement can occur.
Momentum Indicators Support Ongoing Recovery
According to TradingView, the Relative Strength Index is currently at 62.81, which indicates that there is strong bullish strength without being in the overbought zone.
This is due to the fact that the RSI is above 50, its moving average, and the neutral zone, indicating that there is considerable buying interest in the token. It is technically possible for the token to go higher without becoming overvalued.
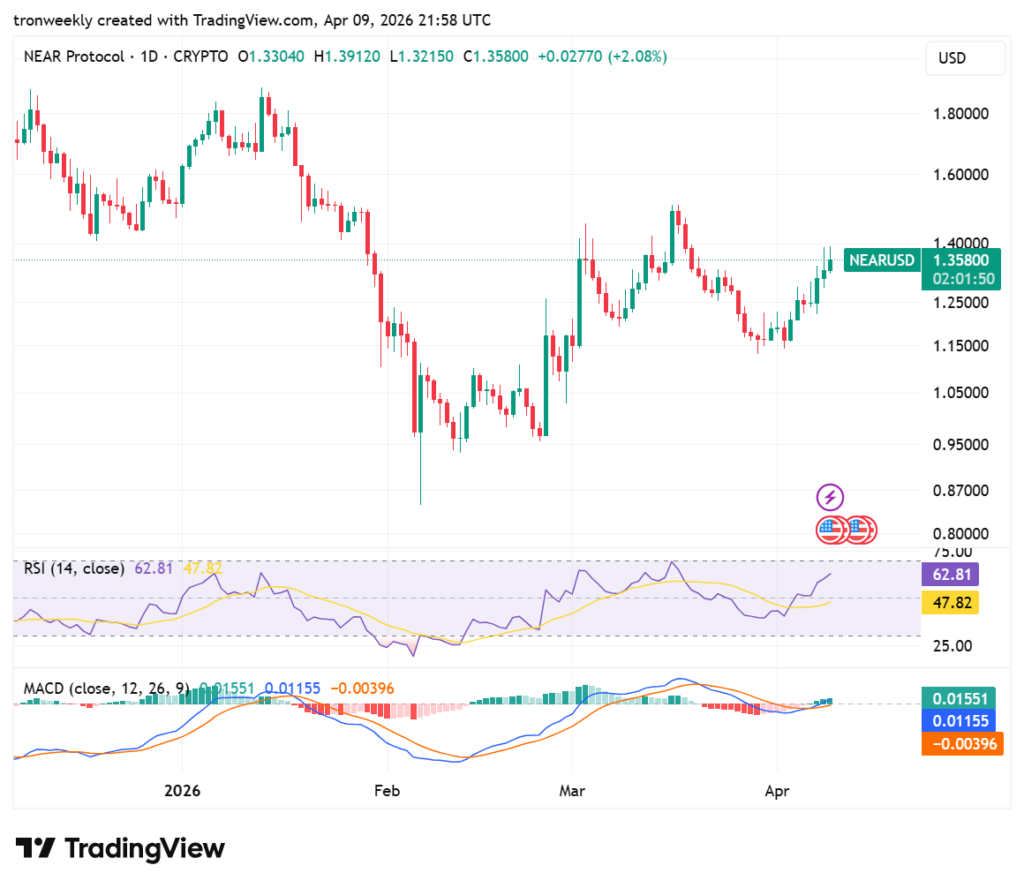
Source: TradingView
Bullish divergence is witnessed through the MACD indicator, which shows that the blue MACD line is now above the orange signal line.
The histogram, on the other hand, has moved into the green region, signifying that there is now increased positive momentum. With these lines crossing to the side of the zero level, the previous bearish outlook becomes invalid.
This article contains market analysis and price predictions. These are not guarantees. Crypto markets are volatile. Always DYOR. Not financial advice.
Also Read: NEAR Protocol (NEAR) Shows Early Bottom Signs as Bulls Eye $5 Target

Be the first to comment