


What to know:
- PENGU’s price stays weak as sellers dominate and buyers fail to regain momentum.
- Key support at $0.00578 is in focus, as failure may trigger a further downside move.
- RSI and MACD remain bearish, signaling weak trend strength and ongoing selling pressure.

The PENGU price remains under pressure as bearish sentiment continues to dominate the market. Sellers are still active, while buyers show limited strength. The broader trend stays weak, with price action struggling to regain momentum in recent sessions.
Pudgy Penguins (PENGU) price is trading at $0.006088, showing a 2.99% decline in a day. The trading volume is up by 12.17% and is currently standing at $50.77 million. Over the last week, the PENGU price has gone down by 2.85%, according to CoinMarketCap.
Also Read: PENGU Consolidates Near $0.006: Will Bulls Push It Toward $0.022?

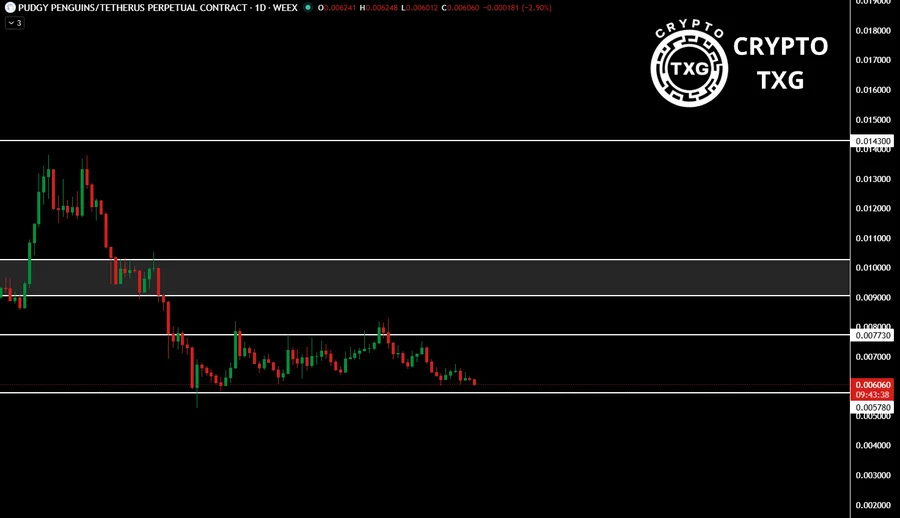
PENGU Price Tests Key Support Zone
Analyst Crypto TXG highlighted that the PENGU price failed to reclaim the $0.00773 level. This rejection led to further downside movement. The price is now approaching a key support at $0.00578. A reaction from this zone may help stabilize the price within a range.
However, a breakdown below support could shift the structure lower. It may open the path for further losses. Traders are watching this level closely as it may define the next move in the market.
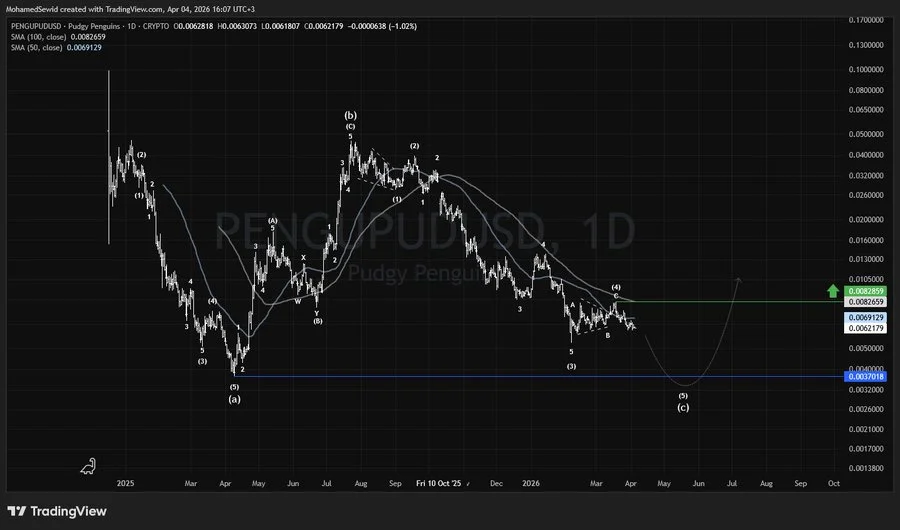
Additionally, another analyst, M.G. Sewid, mentioned that the cryptocurrency continues to experience a consistent downward movement from its high point in mid-2025. The analyst noted that the price is weak until it breaks above $0.00829.
The analyst further identified a possible bottom formation below $0.00370. The situation would hinge upon persistent bearish sentiment. A recovery phase may only begin after a stable base is formed at lower levels.
Volume Climbs as Open Interest Declines
According to CoinGlass data, future volume is up 8.23% to $87.58 million. On the other hand, open interest fell 2.33% to $60.71 million. The OI-weighted funding rate is 0.0019%, showing a slight positive bias.
RSI and MACD Signal Weak Momentum
From a technical perspective, the Relative Strength Index (RSI) is currently at 37.22 and below the neutral 50 reading. This implies that the momentum of the prevailing trend is very weak.
The RSI moving average has been recorded at 42.58. In this regard, the indicator does not point to any extreme oversold level. There are more chances of the price continuing to move lower.
In addition, the Moving Average Convergence Divergence (MACD) indicator is showing bearishness in the market. The MACD line is currently at -0.000059, while the signal line is at -0.000191.
The MACD histogram is currently negative at -0.000250. This suggests that sellers have continued to exert pressure on the price, with no bullish crossover.
This article contains market analysis and price predictions. These are not guarantees. Crypto markets are volatile. Always DYOR. Not financial advice.
Also Read: Bitcoin Consolidates Near $66,800, Facing $67,700-$68,500 Resistance Zone

Be the first to comment