


What to know:
- Polkadot (DOT) consolidates near $1.50, showing neutral sideways movement along the 20-day SMA.
- Technical indicators like RSI and Bollinger Bands suggest potential upside if bullish momentum continues.
- DOT has a 24-hour dip of ~0.64% but maintains a weekly gain of ~6.27%, with resistance at $1.62 and support at $1.40.


Polkadot (DOT) is showing a mild decline in its short-term price action after a mostly sideways trading session. According to CoinMarketCap, over the last 24 hours, DOT has slipped by approximately 0.64%, despite maintaining a weekly gain of around 6.27%.

Source: CoinMarketCap

Currently, DOT is trading at $1.49, with a 24-hour trading volume of $119.26 million, reflecting a 26.74% drop in activity. Its market capitalization stands at $2.5 billion, indicating steady investor interest despite the intraday pullback.
Polkadot (DOT) Eyes Upside as Bullish Momentum Builds
However, Polkadot (DOT) is gaining popularity in the cryptocurrency space as the bull run continues to build momentum in the cryptocurrency space.
According to a crypto analyst known as Hailey LUNC XRP, the asset is looking strong this cycle, indicating that it could rally to the $11 mark, which is a huge move considering the current bull run.


Source: Hailey LUNC XRP’s X Post
Market participants are cautioning against fading strength, which is a common term used in trading to refer to an asset that is displaying strength over a period of time.
Supporters of this token cite its ecosystem, technology, and development activity as catalysts in the future. Although a 10X price move is highly speculative, traders are considering this token one of the altcoins that can break out this cycle.
Also Read: Polkadot Eyes $2.76 Upside After SEC Names DOT a Digital Commodity
DOT Technical Outlook Shows Downward Pressure
According to TradingView, the current situation in the market, represented by the price action in the DOT, is a neutral consolidation phase.
This is a point where the price is closely balanced in relation to the 20-day SMA. There is a squeeze in the Bollinger Bands, and the resistance is at $1.62, with a stable floor at $1.40.
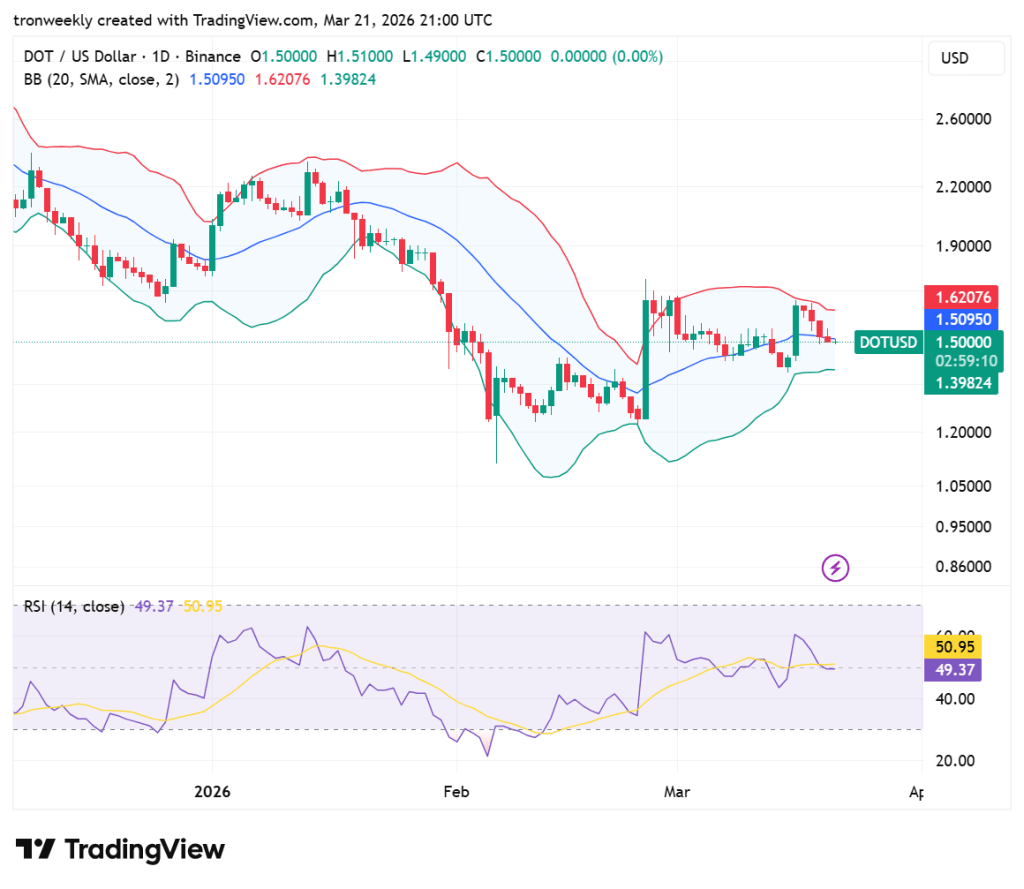
Source: TradingView
This sideways movement is further supported by technical indicators, where the RSI is currently at 49.37. This is near the 50 midpoint, and the asset is not overbought or oversold.
Market players are looking for a break above the upper band or below the lower support to determine the direction of the next big trend in DOT.
This article contains market analysis and price predictions. These are not guarantees. Crypto markets are volatile. Always DYOR. Not financial advice.
Also Read: Polkadot (DOT) Targets $3.80 After SEC Regulatory Clarity Boost

Be the first to comment