


What to know:
- Polkadot (DOT) shows short-term stabilization after a recent price decline, with investors monitoring key support levels.
- Critical support zone lies between $1.16 and $1.39; a breakout above $1.93 could signal renewed bullish momentum.
- Technical indicators show weak momentum: RSI below 50, MACD negative, and MA Ribbon resistance slightly above the current price.


Polkadot (DOT) is indicating some stabilization in the short term after a decline in price. Investors are observing whether the cryptocurrency maintains its main support area. There is some consolidation in the market; investors are observing the price to determine whether the DOT will recover or fall further.
At the time of writing, Polkadot (DOT) is trading at $1.42 with a 24-hour trading volume of $381.30 million and a market capitalization of $2.40 billion. DOT price increased by 0.69% over the last 24 hours, according to CoinMarketCap.


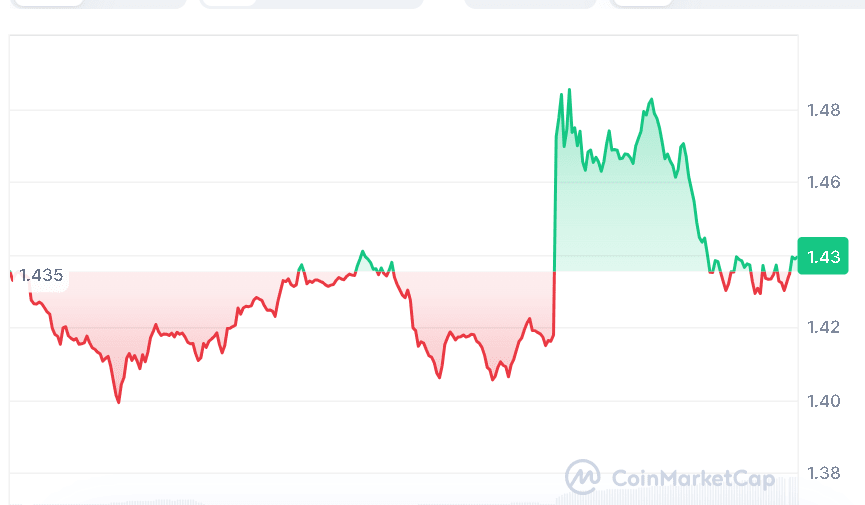
Source: CoinMarketCap
Polkadot Holds Key Support Zone
As crypto analyst More Crypto Online reports, DOT is currently finding support within a critical range that sits between $1.16 and $1.39. This range could serve as a foundation for a potential bounce if buying pressure returns. The first level to target on the resistance front is at $1.93. A breakthrough in this could be a sign that bullish pressure is building.

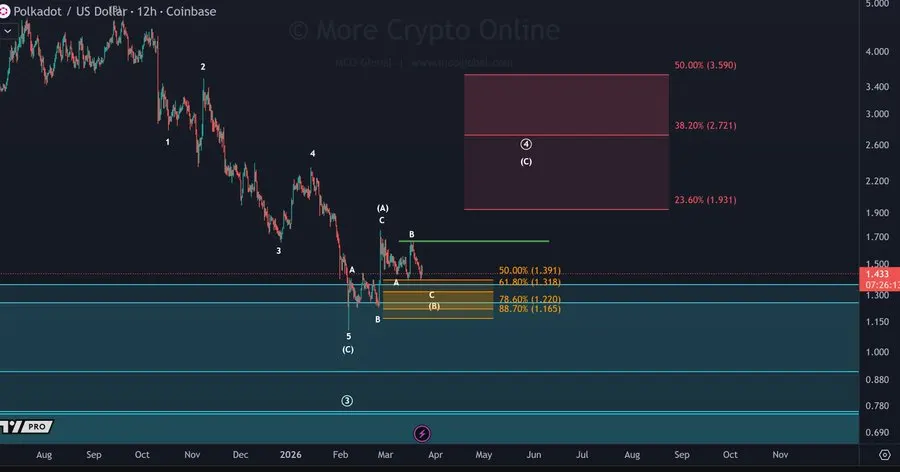
Source: More Crypto Online’s X Post
More Crypto Online noted that failing to contain prices within the range of $1.16 to $1.39 may result in further losses for the currency, whereas holding within this range may attract buyers seeking a short-term rebound.
It will be important to watch for increased trading volumes to determine whether prices are rising due to increased buying activity or falling due to decreased selling activity.
Also Read | Bitcoin Sell Pressure Drops as Whale Flows Decline, Miners Sell
DOT Faces Short-Term Momentum Loss
From a technical perspective, the RSI is at 45.32, indicating weak momentum as it is below the 50.16 line. DOT is quoted at $1.437, just below the MA Ribbon resistance at $1.439 and $1.498.
The higher price averages of $1.686 and $2.446 are still above the current price, indicating that the overall trend remains bearish.
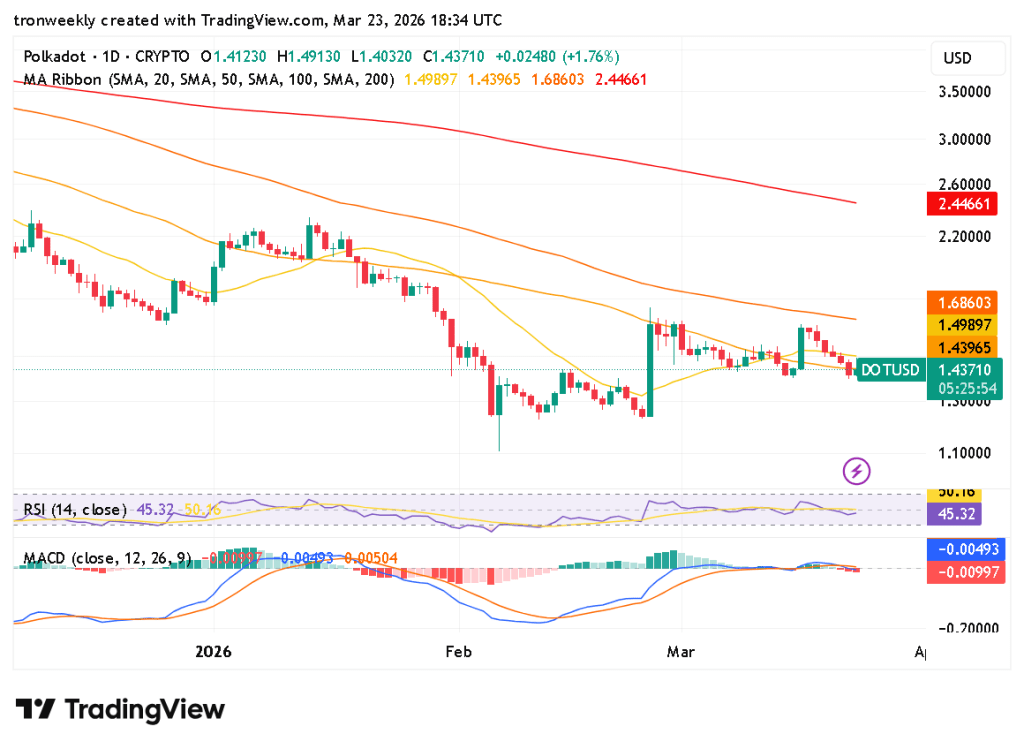
Source: TradingView
The MACD value remains negative at -0.00997 and -0.00493, reflecting low buying power. The histogram, which is slightly red at -0.00504, indicates that the selling pressure still remains dominant. Although there has been a slight upturn, the recent flattening of the MACD indicates a loss of short-term momentum.
This article contains market analysis and price predictions. These are not guarantees. Crypto markets are volatile. Always DYOR. Not financial advice.
Also Read | Bitcoin Stalls in No-Trade Zone as $70,600 Resistance and $65,600 Support Hold

Be the first to comment