


What to know:
- Polygon reached an all-time high in transaction throughput on March 24, enabling real-world on-chain payments.
- POL is consolidating below the 200 EMA at $0.1004, reflecting neutral momentum and short-term market indecision.
- RSI near 49.6 and a MACD bullish crossover indicate improving momentum, though a strong uptrend is not yet confirmed.


Polygon has reached an all-time high in transaction throughput, processing more real economic activity than ever. The network’s speed, low fees, and reliability are driving practical on-chain payments, showing blockchain can handle real-world financial transactions beyond speculation. Experts see this as a key milestone for mass adoption.
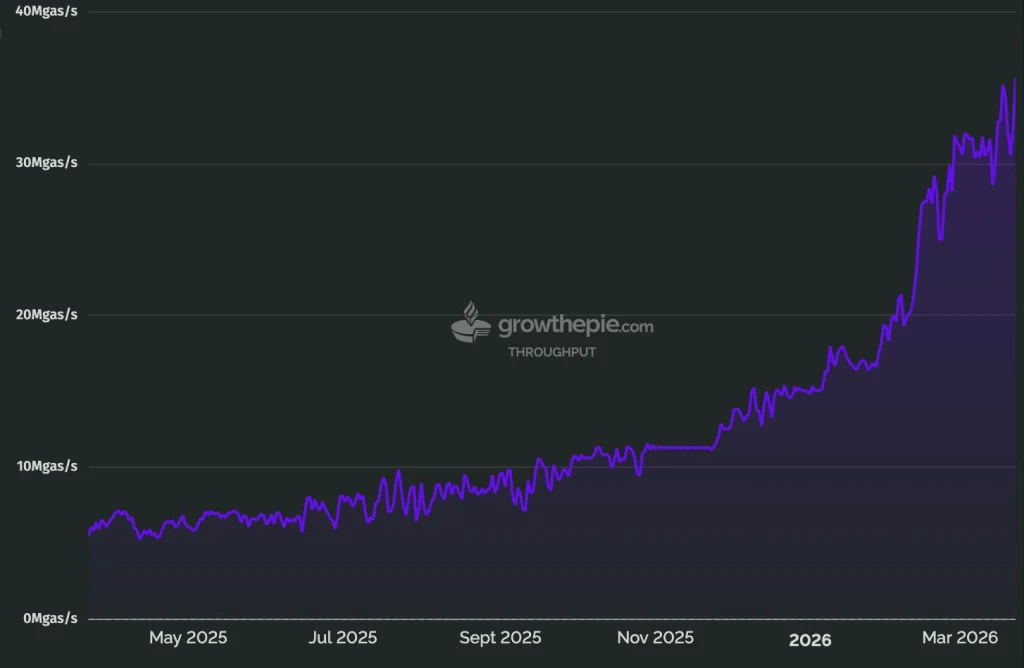
Source: Polygon’s X Post

With robust scalability and efficiency, Polygon is emerging as a critical infrastructure for global digital payments. Its network now provides the rails for moving money seamlessly on-chain, supporting businesses and individuals worldwide.
The record throughput demonstrates the platform’s ability to scale, offering a fast, low-cost, and reliable alternative for decentralized finance in a market increasingly hungry for practical blockchain solutions.
Also Read: Polygon-Powered T-REX Ledger Sets New Standard for Global Tokenization
POL Faces Bearish Pressure Below Major EMAs
According to TradingView, POL is carrying a price that continues to be capped by the larger exponential averages, with the 200 EMA resting around $0.1004.
After falling to a recent trough around $0.0910, the price has seen a slight relief rally to $0.0954. The tight spread of the 20, 50, and 100 EMAs indicates a pause in any significant bullish momentum in this area.

Source: TradingView
The Ichimoku Cloud indicates a tug of war, where price continues to trade within the Kumo. Both the conversion line and base line have flattened, which indicates a neutral short-term trend.
For a breakout to occur, bulls need to break back above the cloud resistance and the 200 EMA or risk a retest of the previous $0.0910 support.
Momentum Indicators Show Improving Upward Potential
The RSI indicator is at 49.60 and hovering around the 50 neutral zone. The indicator has been rising from the oversold zone near 30 recorded earlier this week.
The indicator shows that the recent selling pressure has eased somewhat, but no side has yet emerged as a winner. The POL price action continues in a consolidatory mood, awaiting a breakout from the neutral zone.

Source: TradingView
The MACD gives a hopeful sign as the blue line slightly rises above the orange line. Despite the fact that the histogram turns green, both lines are below the zero line, indicating that the rebound might be weak.
The momentum line is rising towards the positive zone, but there are no clear signs of a sharp uptrend to confirm the reversal.
This article contains market analysis and price predictions. These are not guarantees. Crypto markets are volatile. Always DYOR. Not financial advice.
Also Read: Polygon (POL) Holds Key Support in Falling Wedge With $0.41 in Sight

Be the first to comment