


What to know:
- PUMP is stabilizing in a high-timeframe accumulation zone after a prolonged downtrend, signaling a potential bullish reversal.
- A breakout above the $0.0030 resistance level could trigger a strong upward move with targets reaching $0.015 and beyond.
- RSI and MACD indicators suggest weakening bearish momentum and early signs of building bullish strength.

PUMP is showing early signs of a potential macro reversal after a prolonged downtrend, with price now stabilizing inside a high-timeframe accumulation zone.
According to the crypto analyst Crypto Patel, this compression phase, marked by reduced volatility and the absence of new lows, often signals a shift in market structure and can precede powerful upward expansions once resistance levels are broken decisively.
The asset previously moved within a descending wedge, but momentum has slowed as it enters a discount zone where sentiment remains bearish.

Such conditions are typically where larger players begin accumulating positions quietly, while retail investors stay sidelined. This phase of sideways movement reflects growing equilibrium between buyers and sellers ahead of a potential breakout.
Also Read: PUMP Targets $0.00175–$0.00190 Range After Wedge Breakout
PUMP Signals $0.015 Breakout After Accumulation
Critical levels outline the existing formation, with solid backing above $0.0014 and resistance at $0.0030 serving as the trigger point for a breakout. Given that the foundation is in place, the setup calls for an extension to the upside.
Breaking above resistance could set the stage for an extension process, targeting potential areas such as $0.00504, $0.00867, $0.015, and beyond.
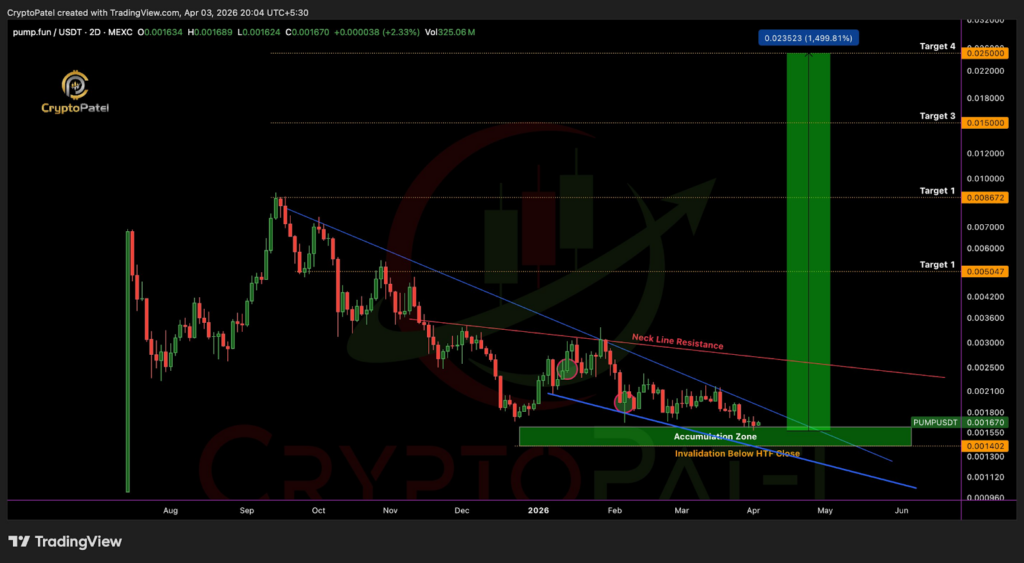
Source: Crypto Patel’s X Post
This kind of configuration shows the nature of market psychology in the formation of trends because accumulation usually happens in low confidence periods.
Given that the base is still intact, the upside move can go beyond 1,500%, which may attract more attention once again. These kinds of patterns seen in other coins have been precursors to rallies in the past.
Momentum Indicators Point to Improving Strength
The RSI index currently holds at 49.20, which puts the asset in a neutral zone. The asset’s price is not overbought or oversold, and it is consistent with the present consolidation pattern.
Although the RSI previously dropped to the level of 30, suggesting that it was oversold, it is now above its signal line by a small margin.
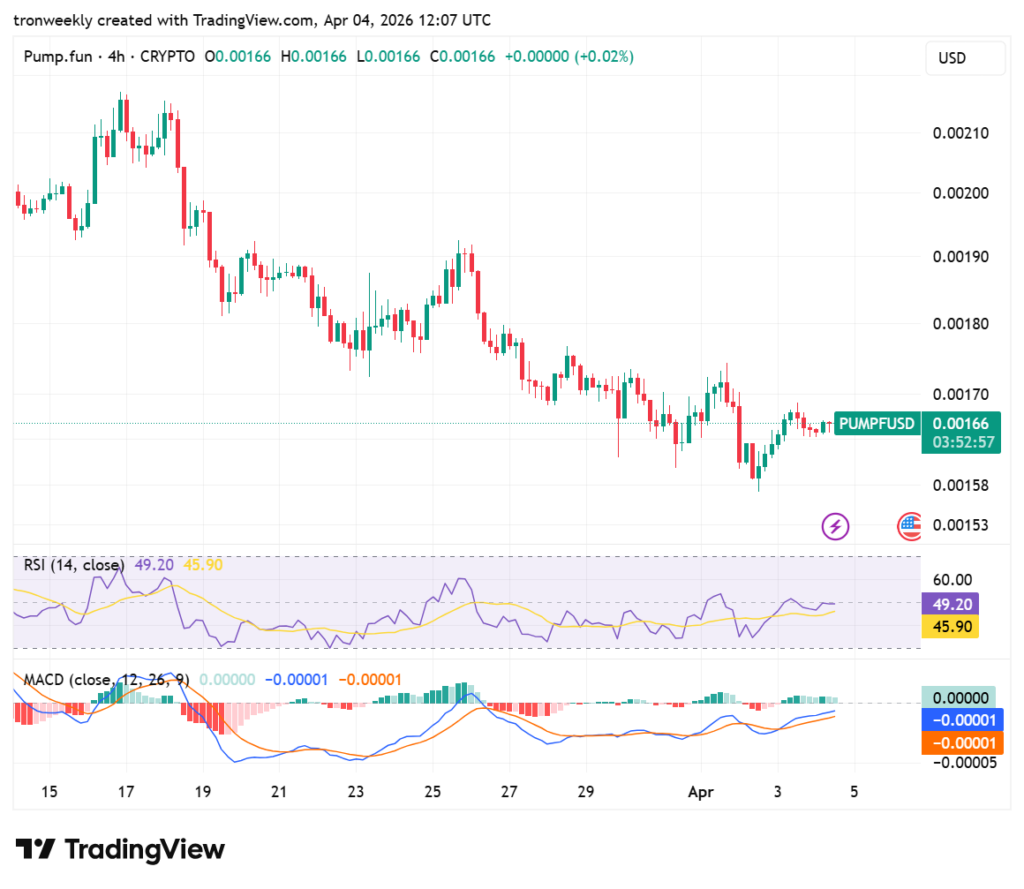
Source: TradingView
The MACD indicator shows low volatility and indecisiveness of the market. The value of both the MACD line and the signal line is at or very close to the zero level at -0.00001.
This indicates that the moving average lines are almost equal. Despite the presence of very small green bars in the histogram, a major crossover is necessary for the breakout.
This article contains market analysis and price predictions. These are not guarantees. Crypto markets are volatile. Always DYOR. Not financial advice.
Also Read: Pump.fun Unveils Automated Buybacks for Tokenized Agents

Be the first to comment