


What to know:
- PUMP compresses in a falling wedge as volatility drops across key timeframes.
- A breakout above trendline may push PUMP toward the $0.00175–$0.00190 zone.
- EMAs cap upside as weak momentum and low volatility keep traders cautious.
Pump.fun (PUMP) is in a crucial phase as price is compressing in a tightening range. Volatility is decreasing in all significant time frames. Traders are awaiting confirmation of the next directional move.
According to CoinMarketCap data, PUMP is currently trading at $0.001667, up 0.64% in the past 24 hours. The trading volume stands at $68.18 million, with a market capitalization of $553.43 million. The token has gone down by 6.22% over the last seven days.
PUMP Wedge Signals Breakout Setup
Analyst Alpha Crypto Signal highlighted a falling wedge pattern on the 4-hourly chart. The pattern is identified by lower highs and lower lows, which indicates a controlled decline.

The momentum on the downside is weakening, and this indicates a fading selling pressure as the price approaches the apex of the wedge, which may indicate a potential exhaustion of sellers.
The analyst pointed out that, as long as PUMP holds in this range, this pattern remains valid. The pattern typically indicates a potential reversal, but confirmation is needed.
A breakout will depend on reclaiming the upper trendline. Volume support is required for this. If this happens, the price has the potential to target the range of $0.00175 to $0.00190. This range acts as the next level of resistance.

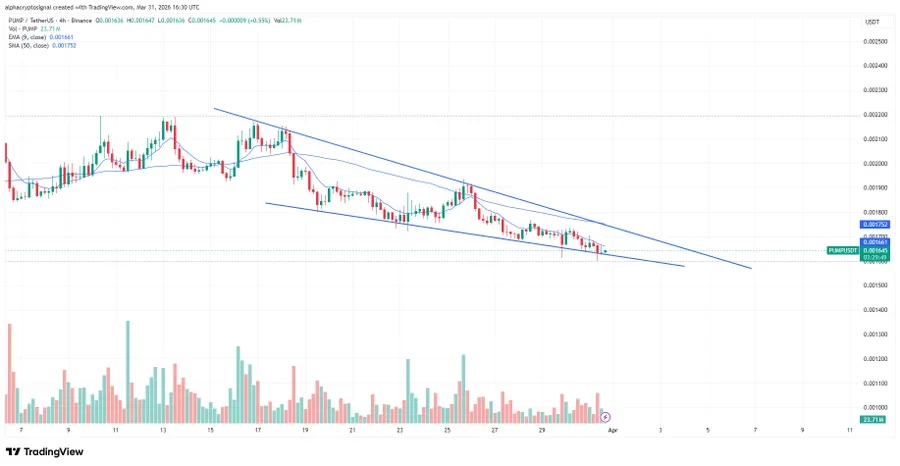
The price has the potential to fall if it fails to hold the support of the wedge. If this happens, it will invalidate the pattern. The price has the potential to fall further.
Also Read: Pump.fun Unveils Automated Buybacks for Tokenized Agents
PUMP Stays Below Key EMAs
From a technical perspective, the exponential moving averages are capping the price. The 20 EMA is at $0.001818. The 50 EMA is at $0.001967. These levels act as immediate resistance above the current price.
The higher EMAs are still well above the market price. The 100 EMA is at $0.002240. The 200 EMA is at $0.002927. This is an indication that the bearish trend is still in place.
The Bollinger Bands are indicating low volatility. The upper band stands at $0.002156. The middle band is at $0.001864. The lower band sits at $0.001571. The price is trading close to the lower band.
Futures Data Shows Mild Bullish Bias
CoinGlass data shows mixed signals in derivatives activity. The trading volume has decreased by 7.39% to $150.82 million. The open interest has increased by 4.56%, reaching $139.35 million. The OI-weighted funding rate is at 0.0060%, indicating a slight bullish bias.
This article contains market analysis and price predictions. These are not guarantees. Crypto markets are volatile. Always DYOR. Not financial advice.
Also Read: Cardano (ADA) Whale Accumulation Hints at an Explosive Move Toward $10+

Be the first to comment