


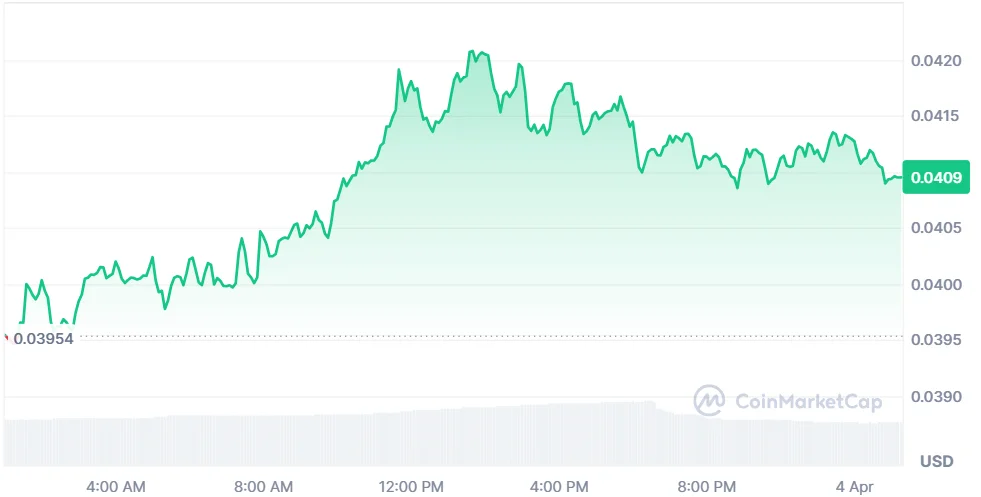
PYTH price is attempting to recover as it approaches a key resistance zone on the daily chart. The asset is showing short-term strength after recent gains. Market participants are closely watching the next move.
As of writing, Pyth Network (PYTH) price is trading at $0.04095, marking an increase of 3.71% in the past 24 hours. The trading volume is down by 7.3% and is currently standing at $17.87 million. Over the last week, the PYTH price has gone up by 8.62%, according to CoinMarketCap.
Also Read: Pyth Network (PYTH) Nears Breakout With Targets Set At $0.07–$0.18
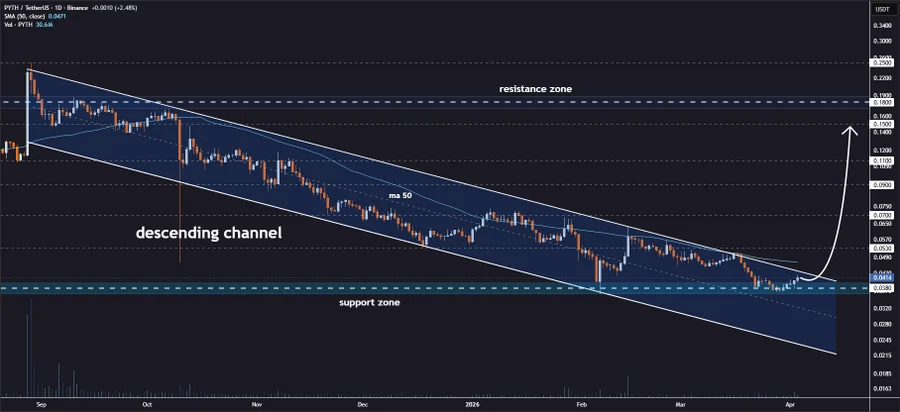
PYTH Tests Major Resistance With Defined Upside Targets
Jonathan Carter, an analyst, highlighted that the PYTH price is approaching a resistance ceiling of a downward channel that has dictated price action for weeks. This level is now behaving like a major resistance area. A confirmed breakout above this structure would also indicate a trend change and invalidate the ongoing bearish formation.

A breakout through resistance would create a clear path to the upside, the analyst said. As per the above structure, the analyst mentioned $0.053 as the first point of breakout, followed by possible intermediate targets at $0.070 and $0.090, respectively. If momentum holds, targets at $0.110 and $0.150 may follow suit.
Open Interest Rises as Volume Drops
According to CoinGlass data, the future volume has fallen by 15.03% to $36.64 million, but the open interest has grown by 3.89% to $21.34 million. The OI weighted funding rate is at -0.0038%. This indicates that short positions still dominate.
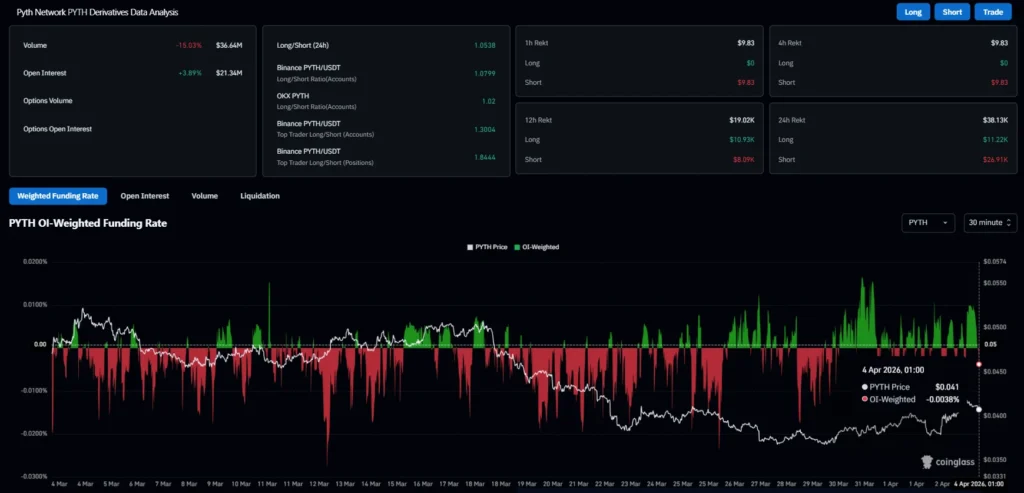
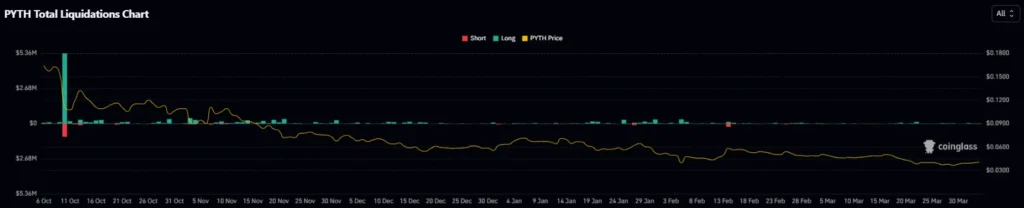
Liquidation data shows limited impact in the past 24 hours. Liquidation totals are at $38.13K. Short liquidations were at $26.91K, while the amount of long positions stood at $11.22K.
Bearish EMA Setup Persists While RSI Signals Mild Strength
From a technical perspective, Exponential Moving Averages (EMA) indicate that the trend remains weak. The 20-day EMA is currently at $0.0414 and is slightly higher than the current price. This is the first resistance and will prevent any upside.
The 50-day EMA is currently trading at $0.0461 and represents yet another hurdle for bulls. For the price to be able to break out above this level would be an indication of its strength. Prior to this, recovery efforts could attract selling interest.
The medium- to long-term technical picture continues to look bearish according to EMA. The 100-day EMA is at $0.0549, whereas the 200-day EMA currently sits at $0.0766. These levels highlight the distance from a full trend reversal.
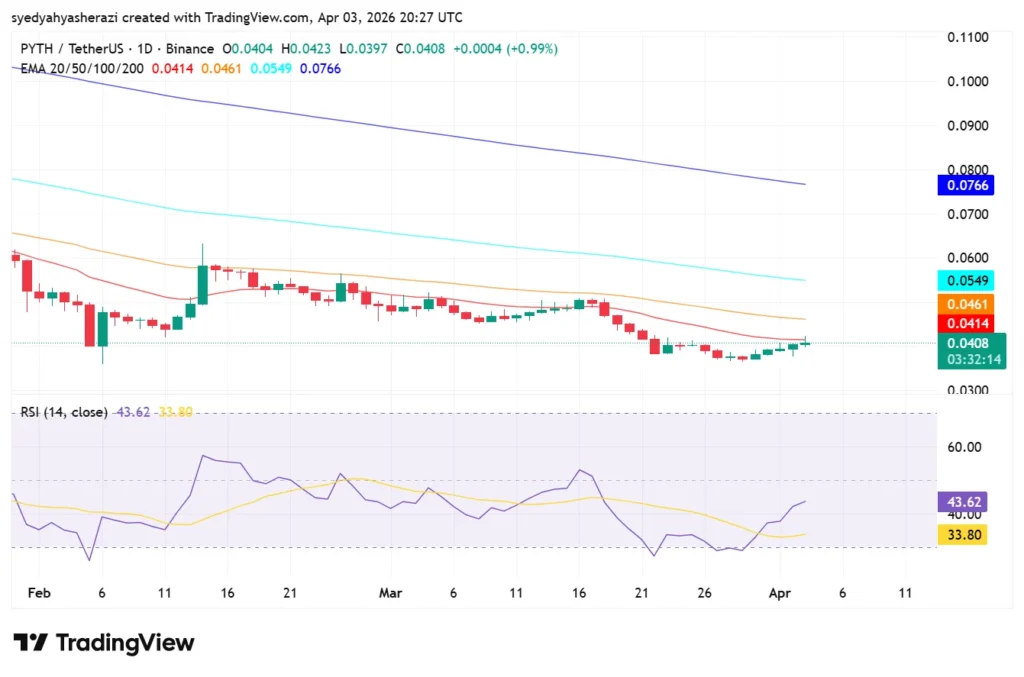
The Relative Strength Index (RSI) data shows poor yet rising momentum. The current reading on RSI is 43.62, lower than the neutral point of 50. However, the RSI average is 33.80, which signals improvement from previously low points.
This article contains market analysis and price predictions. These are not guarantees. Crypto markets are volatile. Always DYOR. Not financial advice.
Also Read: SUI Eyes $0.90–$0.92 After Stabilizing at $0.85 Support Level

Be the first to comment