


What to know:
- Quant (QNT) has broken short-term resistance near $74.37, signaling renewed bullish momentum.
- Trading volume rose nearly 30% in 24 hours, strengthening the breakout confirmation.
- Analysts see potential upside toward $80.60 short term, with broader targets up to $165 if momentum holds.

Quant (QNT) is trading at $74.74 on Monday, April 6, 2026, after posting a 2.56% daily gain and breaking above a closely watched resistance level at $74.37. The move has been accompanied by a notable increase in trading activity, with 24-hour volume rising 29.73% to $13.77 million, signaling stronger participation from short-term traders.
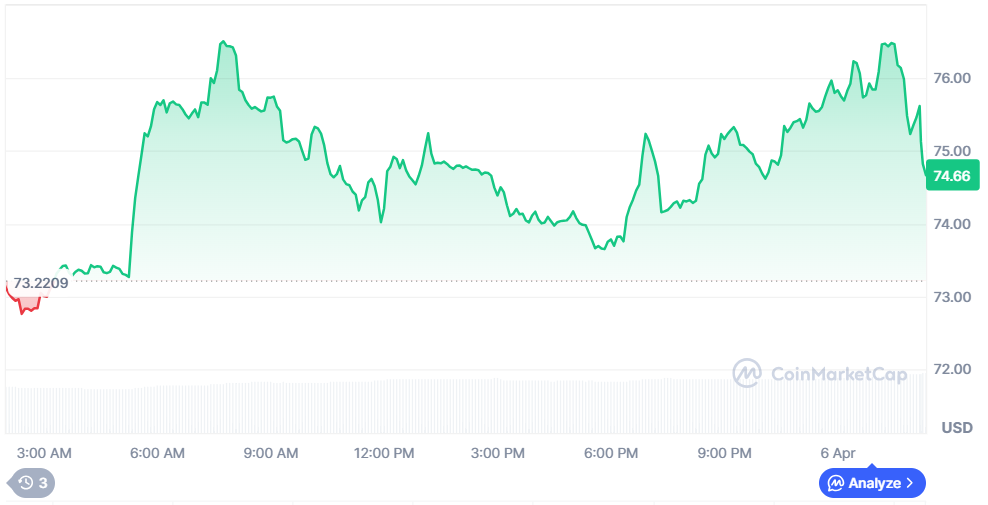
The breakout places QNT in a key decision zone where traders are assessing whether momentum can sustain above recent highs or fade back into consolidation. Market positioning suggests early signs of trend continuation, but confirmation is still dependent on volume stability and follow-through buying pressure.
Bollinger Bands Signal Rapid Price Swings
According to crypto analyst Adam Russell, QNT has already cleared the $74.37 resistance and briefly touched $76.10, supported by a volume spike of 13.02 million. He notes that the next technical target is $80.60, provided that exchange supply continues to decline and selling pressure remains limited.

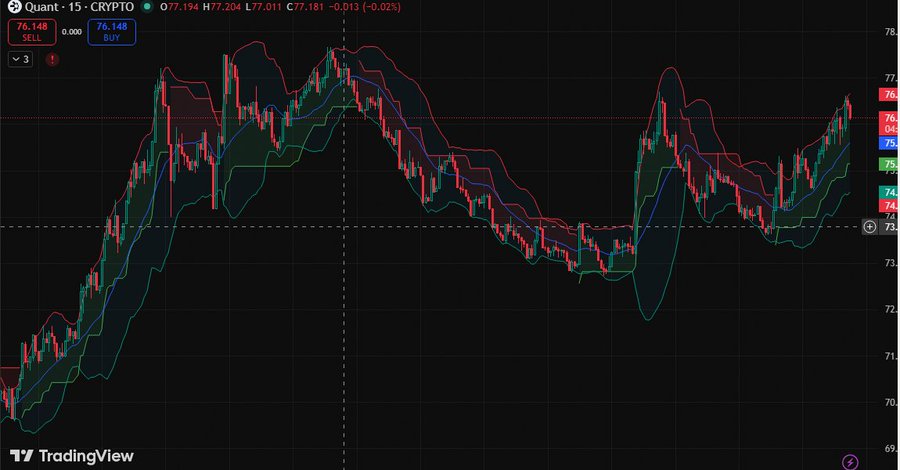
Intraday chart behavior on the 15-minute timeframe shows volatile price action with repeated expansions and contractions around Bollinger Bands and short-term moving averages.
This pattern reflects an active speculative environment where momentum shifts rapidly between buyers and sellers rather than forming a stable trend. Price action is currently positioned near the upper range of recent consolidation.
While bullish momentum is visible, repeated rejections near upper volatility bands suggest that overhead resistance remains active. A sustained close above the breakout zone would be required to confirm stronger directional continuation.
Also Read | Quant (QNT) Now Live on Robinhood: Bullish Breakout Signals $110 Rally
Quant Forms Symmetrical Triangle Pattern
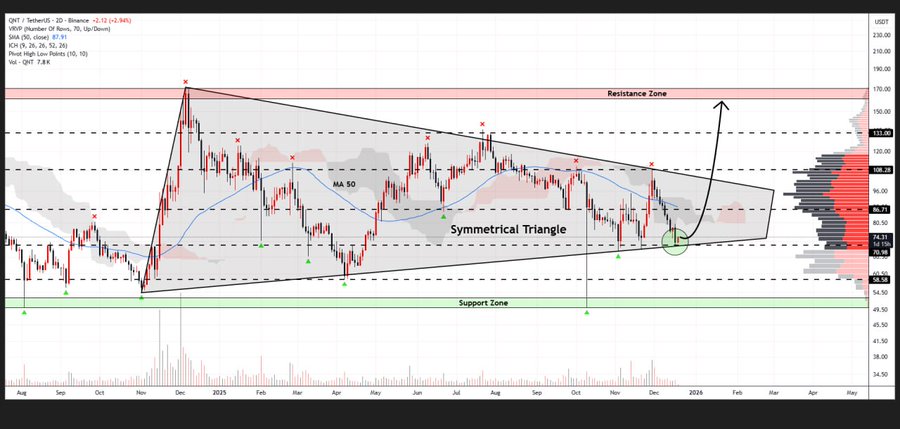
Crypto analyst Whales Crypto Trading highlights that QNT is trading within a symmetrical triangle pattern on the 2-day chart following its prior rally toward the $170–$190 region.
The structure reflects a period of compression between a descending resistance trendline and a rising support base near $55–$60. At present, QNT is hovering near the $70–$75 demand zone, which also aligns closely with the 50-day moving average.
This region is considered structurally important, as repeated defense of this level could support a rebound toward $90–$110 in the next liquidity zone. If bullish momentum strengthens, a breakout from the triangle could extend toward the $165 region.
However, a breakdown below support would invalidate the bullish setup and potentially return the asset to lower accumulation levels. Market structure overall remains balanced, with volatility compression suggesting that a larger directional move may be approaching once volume confirms breakout direction.
Also Read | Quant (QNT) Eyes $100 Breakout as Reversal Signals Build

Be the first to comment