


What to know:
- RENDER tests wedge resistance as price tightens, signaling potential breakout ahead.
- Support at $1.97 holds while resistance near $2.12 continues to cap upside attempts.
- RSI is at 61.97, and MACD stays positive as derivative activity shows reduced momentum.

RENDER hovered near a key resistance zone on April 11, 2026, as price action tightened within a defined structure. Market participants tracked a possible breakout scenario. The setup on higher timeframes kept attention on whether momentum could sustain a directional move.
As of writing, RENDER is trading at $2.00, showing a decline of 1.28% in the past day. The trading volume is down by 34.19% and is currently standing at $49.57 million. Over the last week, the RENDER coin price has increased by 4.97%, according to CoinMarketCap.
Also Read: Render Price Outlook: Will It Break $2 Resistance or Fall Further?

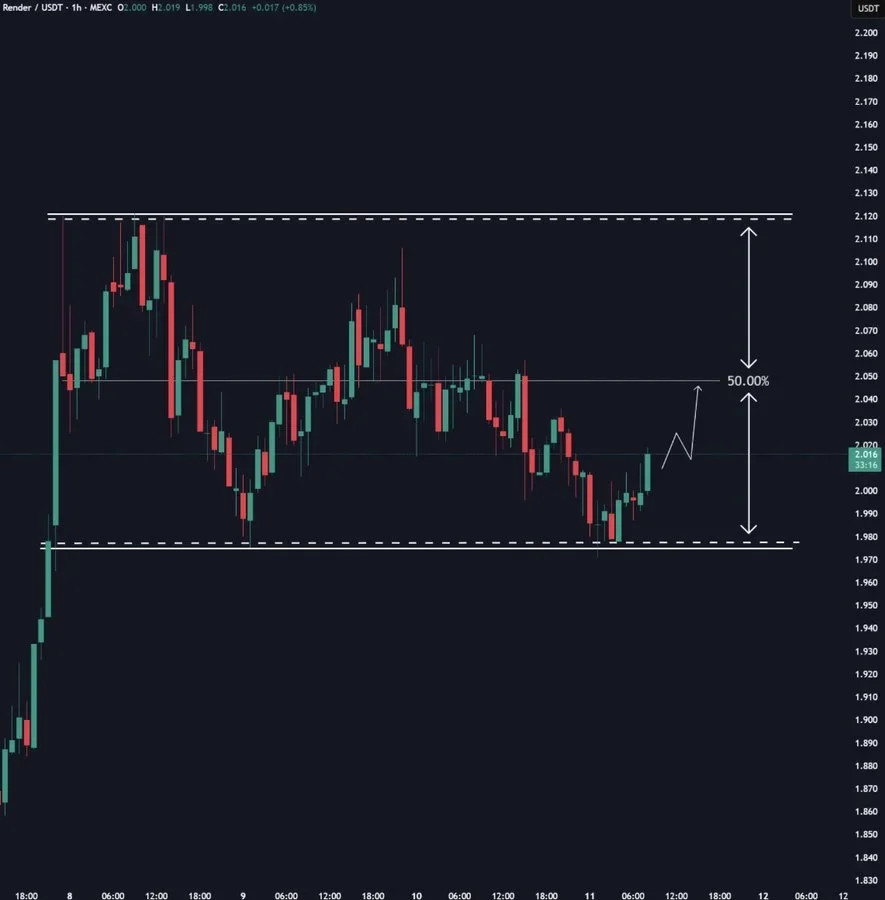
RENDER Tests Falling Wedge Breakout
Jonathan Carter, an analyst, highlighted that the RENDER is making a breakaway move out of the falling wedge pattern on the three-day chart.
The price is currently being tested at the upper boundary of the formation. Such patterns are often linked to potential reversals if confirmed by volume and continuation.
Carter has listed various upside targets according to the formation. These levels are $2.50, $3.40, $4.20, $5.30, $7.30, and $12.00. The levels indicate possible progression points if the breakout holds and momentum builds.


Moreover, another analyst, Crypto Chiefs, mentioned that RENDER continues trading within a horizontal range. Support has been observed at $1.97-$1.98. Resistance has been identified at $2.11-$2.12, creating a distinct upper boundary for the coin.
The token is moving higher after hitting the bottom of the range. Currently, it seems that the price is headed towards the middle part of the range, which is around $2.05.

Derivatives Activity Drops as Volume Declines
Derivatives data from CoinGlass shows reduced activity. The future volume has gone down by 30.74% to $79.84 million. The open interest has also fallen by 1.54% to $63.79 million.
The OI-weighted funding rates stand at 0.0005%. This indicates the neutral position of the trader within the market. In the last 24 hours, total liquidations stood at $61.04K, of which longs are totaled at $40.98K and shorts are worth $20.06K.
RSI Holds Above Neutral as MACD Stays Positive
The Relative Strength Index (RSI) indicates moderate strength. The RSI reading stands at 61.97, while the moving average of the RSI reading is at 60.13. The RSI readings are currently above the neutral region, depicting a controlled bullish trend.
The Moving Average Convergence Divergence (MACD) is still in the positive region. The MACD line is at 0.098, while the signal stands at 0.084. The histogram is at 0.014, indicating continued bullish pressure without sharp divergence.
This article contains market analysis and price predictions. These are not guarantees. Crypto markets are volatile. Always DYOR. Not financial advice.
Also Read: Ethereum Gains 2.26% as Key $1,550 and $1,070 Support Zones Come Into Focus

Be the first to comment