


What to know:
- RENDER testing the upper boundary of a falling wedge, signaling a potential bullish reversal.
- A confirmed breakout above the wedge could push RENDER toward an $11 price target.
- MACD and Bollinger Band indicators highlight ongoing volatility, suggesting cautious optimism for traders.


Render (RENDER) is moving in a downward direction mirroring the changing conditions in the broader crypto market. The RENDER price has declined by 3.36% over the last 24 hours but is up by 2.31% over the last week.
According to CoinMarketCap, the token is trading at $1.66, with a trading volume of $48.9 million, down by 25.27% over the last 24 hours. Furthermore, its market capitalization stands at $863.34 million, which has also declined by 3.37%.

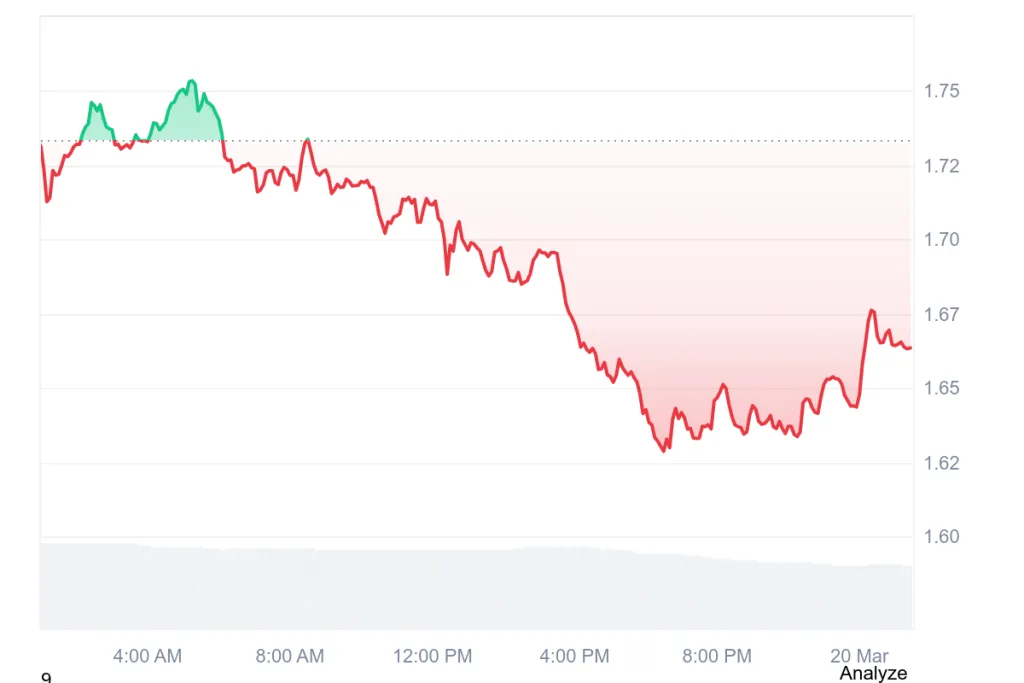
Source: CoinMarketCap
Also Read: RENDER Breakout Imminent: Falling Wedge Pattern Hints a Rally to $12
RENDER Could Surge to $11 After Falling Wedge Break
However, the crypto analyst, Butterfly, revealed that the token is testing the upper boundary of its falling wedge on the 3D chart, a pattern often signaling a potential reversal.
Butterfly highlights that this level is critical; if breached, it may mark a shift from consolidation to bullish momentum. Traders are closely watching as buying pressure steadily increases, indicating bulls are gaining control.
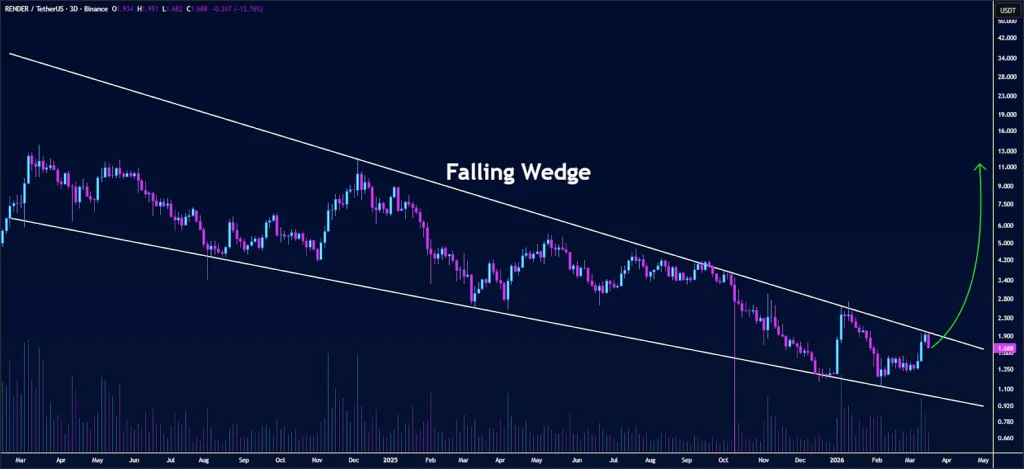
Source: Butterfly’s X Post
A breakout from the wedge will push the token to fresh highs of $11. The push to fresh highs will validate the trend. It will attract more investors to the asset.
Butterfly emphasizes that a breakout is necessary since a burst of momentum can come in a flash. It may be a critical period for both traders and long-term holders of RENDER.
RENDER Technical Outlook Reveals Cautious Optimism
According to TradingView, the token’s price has moved from its peak at $2.60 down to its lowest at $1.30.
Following its recent run to the $1.98 upper Bollinger Band, the token price is currently retracing. It’s currently at $1.66, down by 4.87%, and touching its $1.55 middle moving average in search of new short-term support.
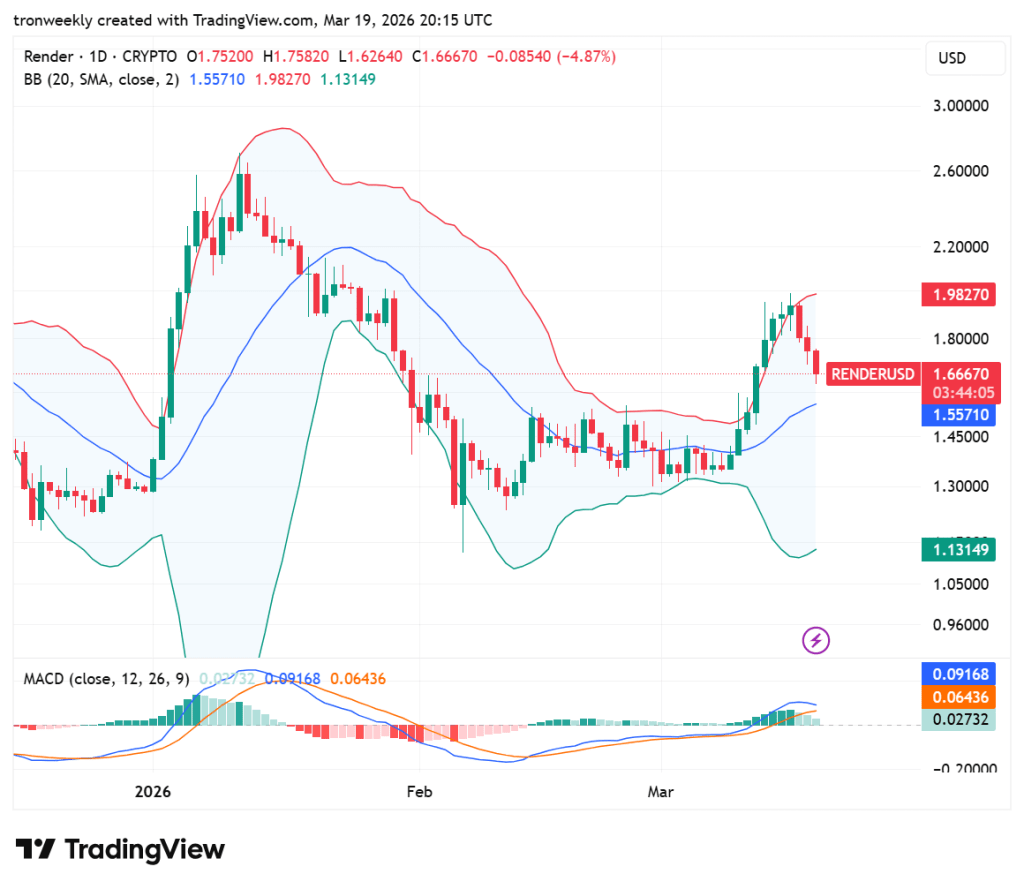
Source: TradingView
Technical indicators show signs of declining momentum as the MACD histogram diminishes even as it remains in positive territory. The Bollinger Bands remain at their widest, reflecting the high volatility. Price action reflects the attempt to hold up at these levels.
The $1.55 levels remain of great interest as to whether this is indeed a pullback or if it is part of a larger trend reversal.
This article contains market analysis and price predictions. These are not guarantees. Crypto markets are volatile. Always DYOR. Not financial advice.
Also Read: RENDER’s Ascending Channel Supports Another Upward Leg Toward $2.050

Be the first to comment