


What to know:
- RENDER remains in a strong ascending channel, with the $1.60 support zone signaling potential trend continuation.
- RSI at 62.97 and a positive MACD crossover indicate growing buying pressure and sustained uptrend momentum.
- Key resistance levels around $2.05 and the 200-day EMA at $2.18 may influence the next price breakout.


RENDER continues to trade within a well-defined ascending channel, keeping its broader bullish structure intact despite the recent pullback.
According to the crypto analyst Alpha Crypto Signals, the price is now approaching the lower boundary of the channel, a zone that has repeatedly acted as dynamic support. This area is viewed by traders as a key trend continuation level where buyers may step in again.


Source: Alpha Crypto Signal’s X Post
As long as this support holds, the overall trend remains bullish and favors a move back toward the upper boundary of the channel around $2.050.
A strong reaction from this level could trigger another upward leg, while a clear breakdown below the channel would weaken momentum and signal a possible shift in trend direction for RENDER.
Also Read: Render (RENDER) Eyes $2.71 Breakout After Major Accumulation Zone Test
RENDER Technicals Show Strong Bullish Outlook
According to TradingView, RENDER shows a bullish reversal pattern as the asset tries to move back into the Ichimoku Cloud.
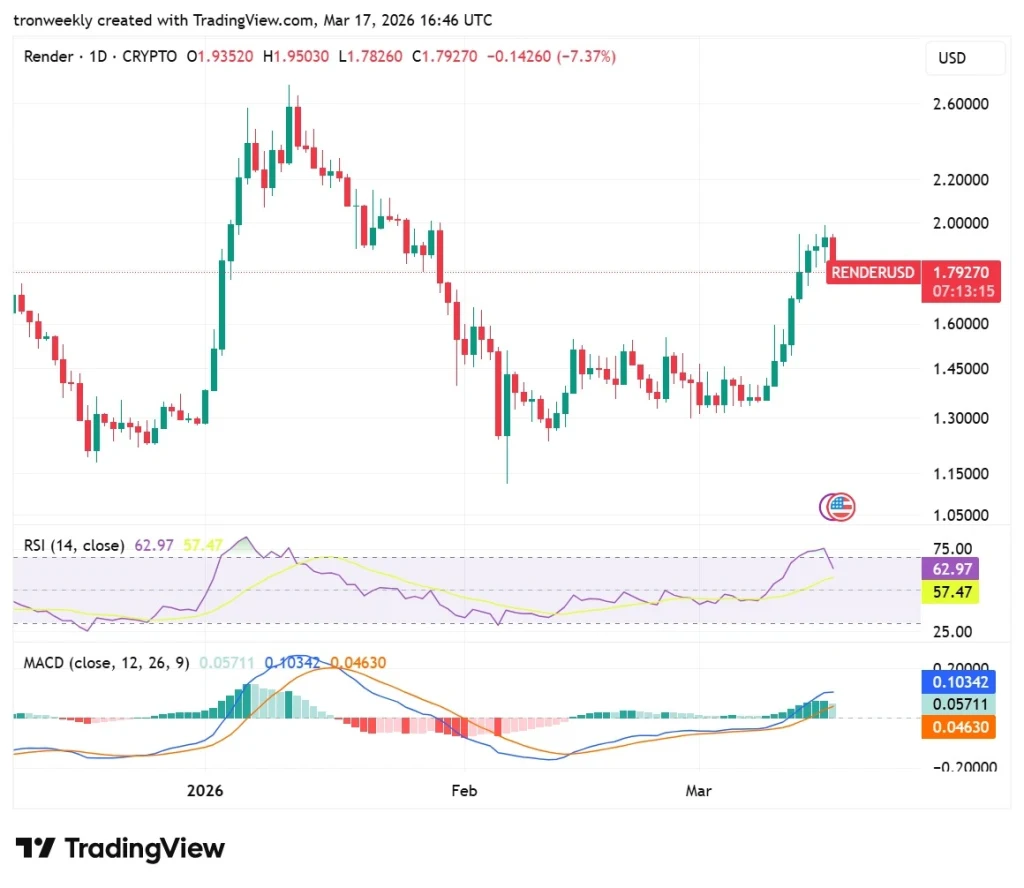
Currently priced around $1.79, the asset has managed to move back above the 20, 50, and 100-day EMAs. The asset is currently facing resistance at the cloud’s upper edge but needs this support for a trend reversal.

Source: TradingView
The resistance at the 200-day EMA, currently at $2.18, has continued to limit the upside price momentum since the latter part of 2025. As long as the price is supported at the $1.60 zone, a breakout above the resistance is expected.
The psychological price target will be the primary resistance. However, if the price fails to hold the support at the moving averages, a retracement to the previous February price levels at $1.10 is expected.
Momentum Indicators Reinforce Bullish Recovery
The RSI currently stands at 62.97. This represents a high level of bullish pressure since it is well above the 50-midpoint. Although the RSI has been pushed down from higher levels, it is still above its signal line of 57.47.
This means the current uptrend is still intact and holding well; however, the curve is slightly dipping, indicating a period of consolidation.
Source: TradingView
The MACD also verifies this uptrending movement because the blue line at 0.10342 is still well above the orange line at 0.04630. The expanding green bars also show that the buying pressure is increasing.
As the two lines move higher into positive territory, the uptrending movement is verified as long as the MACD holds its current distance above the signal line.
This article contains market analysis and price predictions. These are not guarantees. Crypto markets are volatile. Always DYOR. Not financial advice.
Also Read: RENDER Breakout Imminent: Falling Wedge Pattern Hints a Rally to $12

Be the first to comment