


What to know:
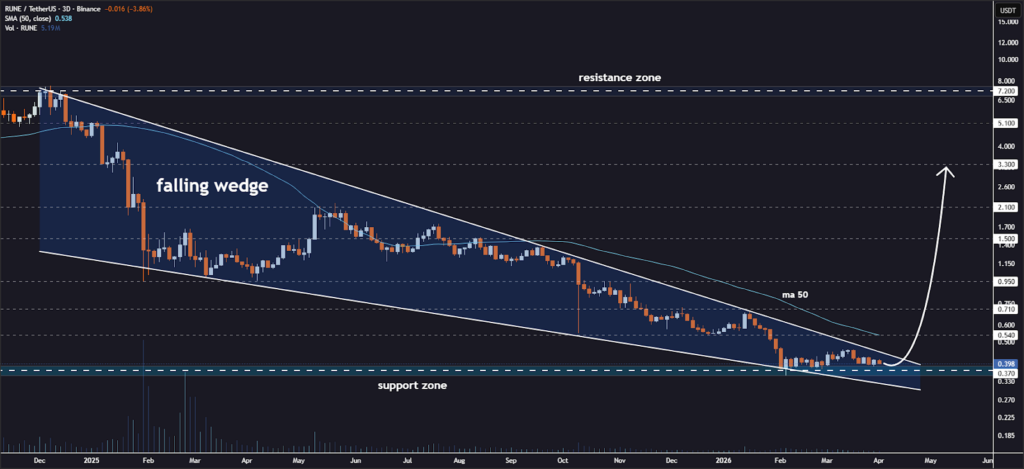
- THORChain (RUNE) is tightening in a 3-day wedge, signaling a potential breakout as buying pressure increases.
- Key resistance near $0.405 remains critical, with a breakout potentially opening upside targets from $0.54 to $3.30.
- Technical indicators show mixed momentum, as RSI stays neutral while MACD remains bearish, reflecting market indecision.

THORChain (RUNE) is approaching a critical wedge resistance on the 3-day chart as price action tightens beneath the upper boundary. According to the crypto analyst Jonathan Carter, the compression signals decreasing volatility while buyers continue absorbing sell pressure.
Momentum is gradually improving, suggesting a potential breakout setup forming if resistance is breached with strong confirmation from volume expansion in coming trading sessions ahead soon.

Source: Jonathan Carter’s X Post

Traders are watching for confirmation of a breakout above resistance, which could unlock upside targets at $0.54, $0.71, $0.95, $1.50, $2.10, and $3.30.
Failure to break higher may result in continued consolidation inside the wedge structure, keeping price range-bound until stronger bullish momentum returns to the market in the near-term outlook ahead for traders watching closely.
Also Read: THORChain (RUNE) Up 28%: Analyst Targets $8 Short-Term, $54 Long-Term
RUNE Technical Outlook Shows Downward Pressure
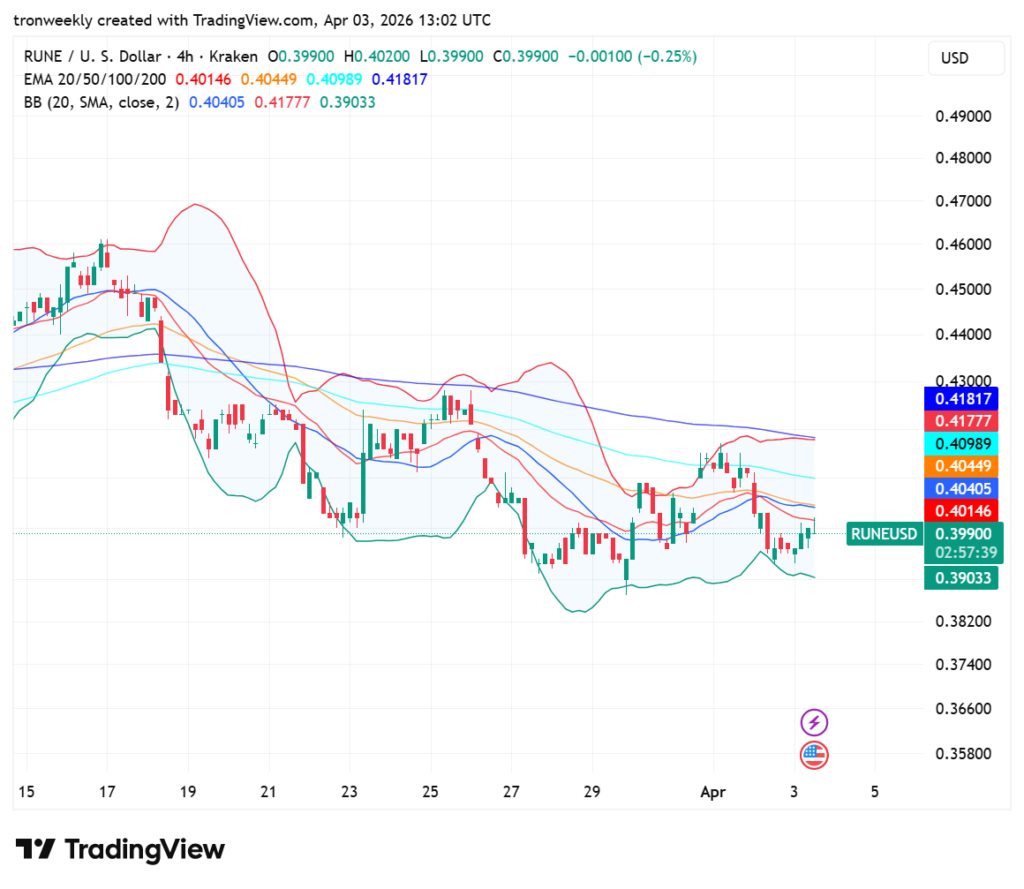
According to TradingView, the RUNE token is showing a consistent bearish pattern, with prices being consistently held down below both the 20-EMA and the 200-EMA.
As the token is currently valued at $0.39900, the immediate resistance level lies at the 20-EMA, while the decline of the 200-EMA further indicates a negative trend in the long term.
Source: TradingView
The Bollinger bands have become significantly tighter, which is an indication of a strong consolidation phase and a volatility squeeze to follow.
The asset’s price is currently oscillating within the range of $0.39033 (lower band level) and $0.40405 (mid-line). One can consider either a break above $0.40500 or below $0.39000 as a crucial point going forward.
Momentum Indicators Point to Cautious Optimism
RSI is currently trading at 45.40, below its signal line of 46.79. The neutral reading below 50 indicates the absence of bulls but not overselling either.
The momentum looks to be stuck in the mud because the oscillator is moving sideways, showing that the market was indecisive after the pullback from its mid-April peaks.
Source: TradingView
A bearish setup is indicated on the MACD chart, where the blue line stands at -0.00178 and is found below the orange line. The negative bars in the histogram show that short-term momentum is falling behind long-term momentum.
Both lines are currently below the zero level, and hence, the indicator shows that the downward momentum has not reversed.
This article contains market analysis and price predictions. These are not guarantees. Crypto markets are volatile. Always DYOR. Not financial advice.
Also Read: THORChain RUNE Set to Surge: Could Hit $3.30 Soon!

Be the first to comment