


What to know:
- SEI remains under pressure as Bitcoin weakness continues to drag the broader altcoin market lower.
- Rising trading activity hints at possible accumulation, but no clear reversal is confirmed yet.
- Price stays below key moving averages, keeping the overall trend bearish.

Sei (SEI) is moving in a downward price movement following BTC’s downward movement after touching $70K resistance. According to CoinMarketCap, the SEI price has declined by 3.73% over the last 24 hours but surged by 6.02% over the last week.
At the time of writing, SEI is trading at $0.05257, with a trading volume of $28.87 million, which has declined by 11.61% over the last 24 hours. However, its market capitalization stands at $16.65 million, which is also down by 3.69%.
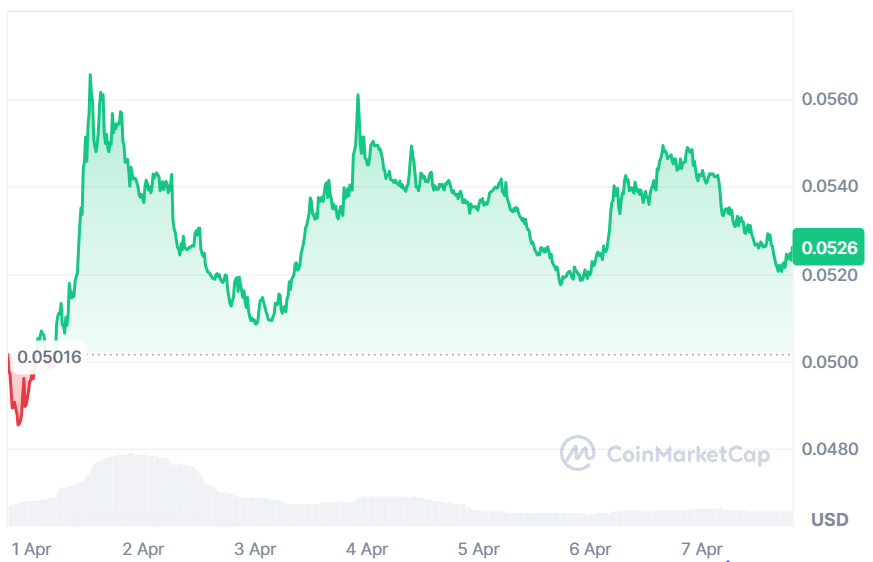
Source: CoinMarketCap

Also Read: SEI Weekly Support at $0.05566 Could Spark Reversal Toward $0.480
SEI Targets $0.10 as Volume Spike Signals Early Activity
However, the crypto analyst CyrilXBT pointed out that SEI is trading near $0.0530, showing continued weakness with no clear bullish structure. The 200-day EMA sits around $0.1267, more than double the current price, highlighting a deeply bearish macro gap.
Despite the downtrend, today’s volume surged to 78.77M, the highest in weeks, hinting at renewed but unconfirmed market interest.
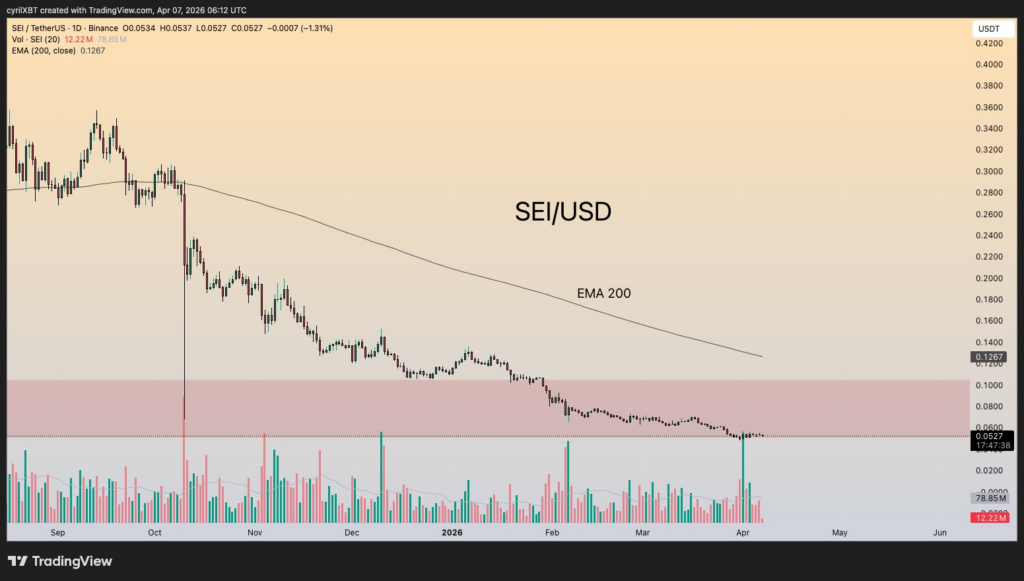
Source: CyrilXBT’s X Post
The sudden rise in volume can be taken as an indication of beginning accumulation, although the price movement still seems weak without any clear direction.
As long as the price of SEI fails to breach $0.10 convincingly, the trend is still regarded as weak. It will be interesting to watch how things unfold.
Momentum Indicators Point to Cautious Optimism
According to TradingView, RSI stands at 45.07, implying neutrality and bearishness. It is below the yellow signal line, signifying a drop in buying pressure.
Although RSI is not oversold, its downtrend indicates that prices are being rejected in the short term. Bulls have not been able to push the price above the key level because of a lack of power.
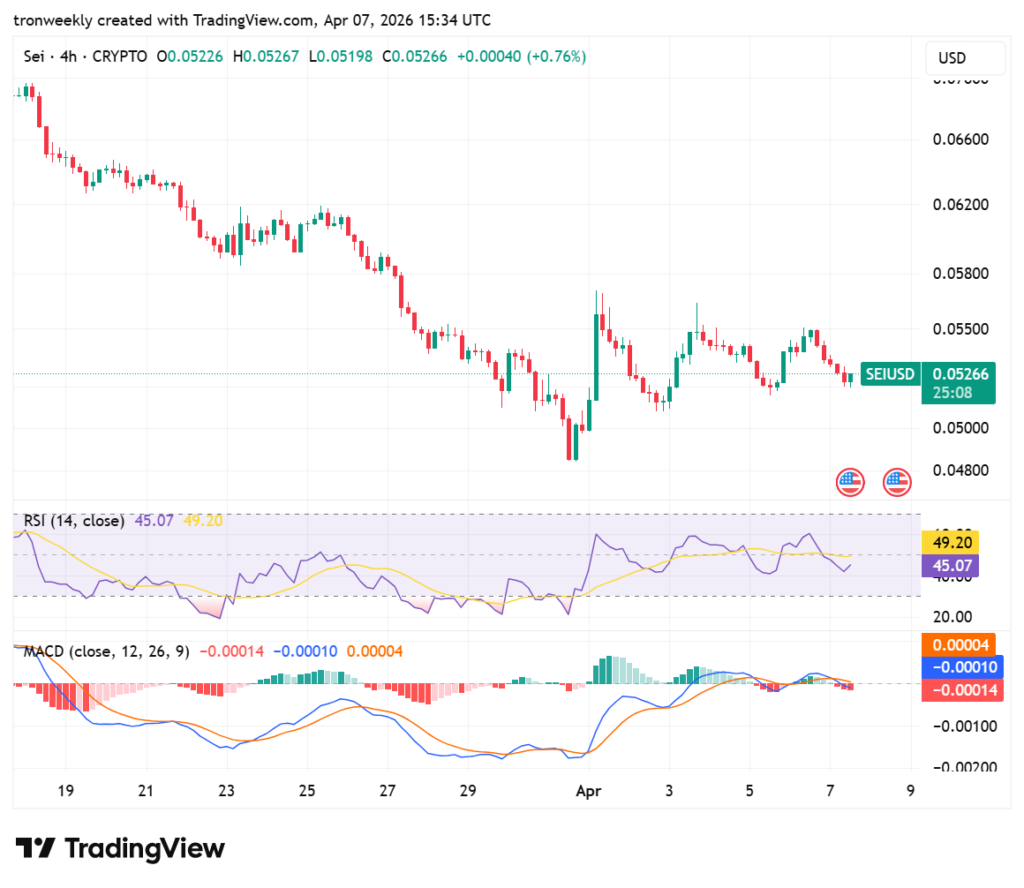
Source: TradingView
MACD supports bearish expectations by breaking down below the orange signal line recently. The red bars in the histogram depict growing negative momentum, as the blue line is falling.
At present, the indicator is hovering around the zero level, indicating a lack of clear trend direction. Reversal of the trend will be marked by a flat line crossing the orange line upward.
This article contains market analysis and price predictions. These are not guarantees. Crypto markets are volatile. Always DYOR. Not financial advice.
Also Read: Sei Price Prediction: Can SEI Break $0.10 Resistance After Recovery Signal?

Be the first to comment