


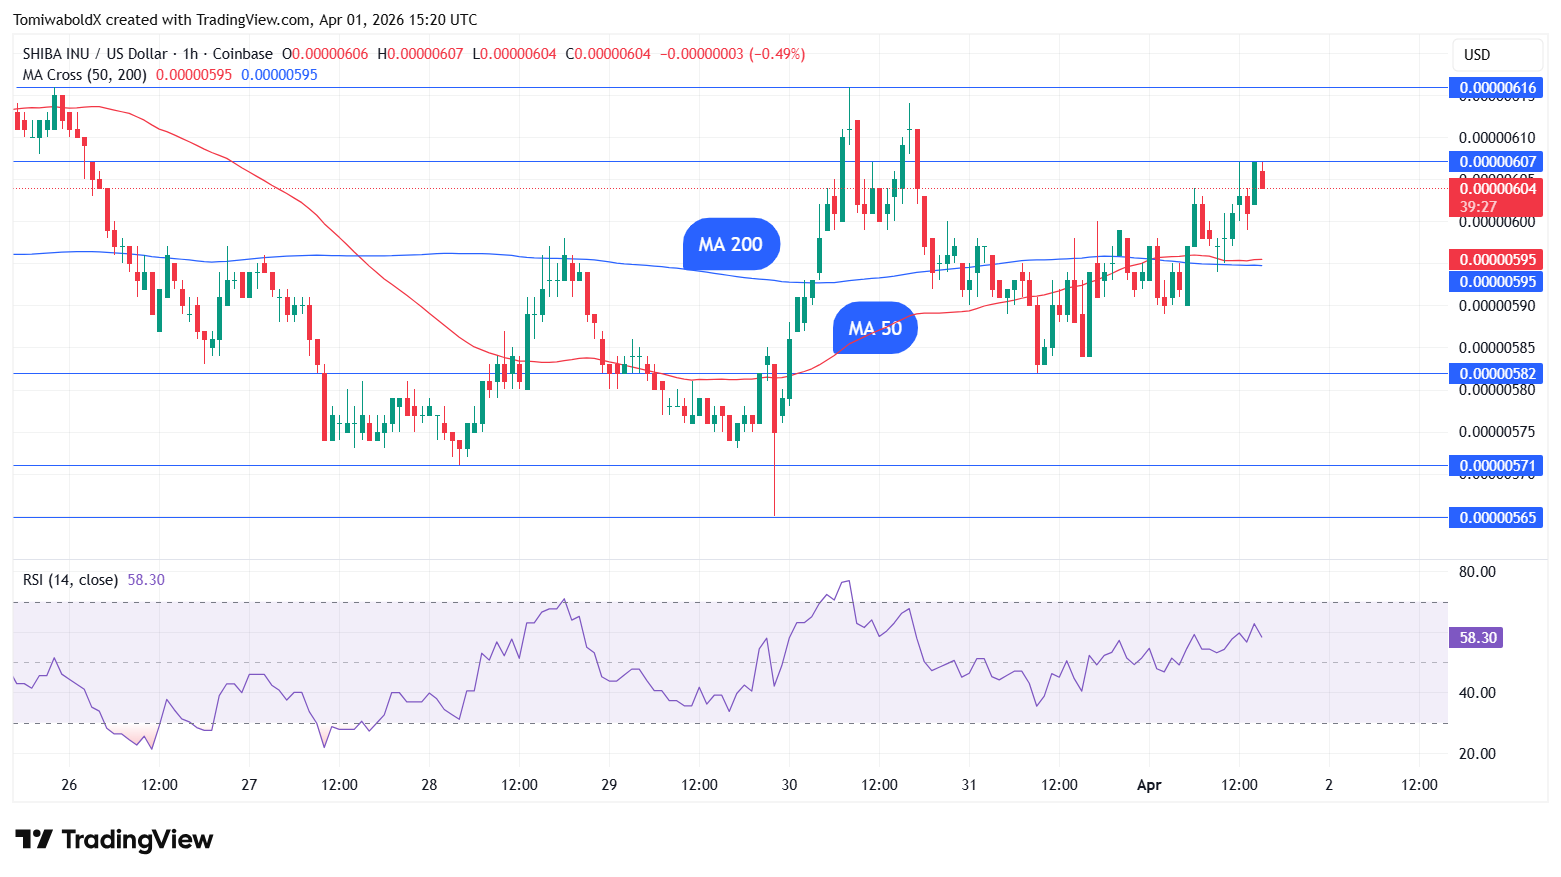
Shiba Inu‘s hourly chart just flashed a golden cross. The moving average 50 has gone above the moving average 200. In the last 24 hours, Shiba Inu has recorded positive price action and shows a 1.43% daily move to $0.000006.
Shiba Inu spot flows stay positive on most time frames and show more supply to exchanges. Inflows have well surpassed outflows, with spot flow increases reaching 7,004% in the last eight hours, according to CoinGlass data. More coins being moved to exchanges might suggest holders seeking to take profits.
You Might Also Like

On the technical charts, momentum stays fragile, with lower highs forming and still defining the short-term structure. Spot markets are showing signs of a slowdown, with trading volume remaining subdued and overall activity quiet.
CoinMarketCap’s figures indicate that Shiba Inu’s volume increased a mere 1.53% over the past day, reaching $109.72 million. This might signify traders less convinced about recent price.
Derivatives market signals a bit of a red flag
Traders are still not convinced, judging by trading positions. Despite this, SHIB‘s open interest climbed almost 3% over the past day, reaching $53.11 million, even as funding rates held steady.
This could mean the groundwork for a rebound is being laid, though more robust demand might be necessary to solidify a lasting price shift.
You Might Also Like

Shiba Inu rose above the daily MA 50 near $0.000006 yet again in March. Previous attempts have seen SHIB unable to sustain a breakout above this level. If it happens, Shiba Inu might aim for $0.00000625, with the ultimate aim of reaching $0.000010. On the other hand, a drop might target support in the $0.000005 range.

Be the first to comment