


What to know:
- SOL is holding a crucial support zone near $86–$87 amid weakening momentum.
- Resistance between $94–$98 continues to cap upward movement.
- Market structure signals a defining phase with breakout or breakdown likely soon.


Solana (SOL) trading near $86, after a sustained weekly decline, with analysts warning that the token is approaching a critical technical level that could determine its next move.
As of the latest trading session, SOL is priced at $86.22, down 0.76% over the past 24 hours, while trading volume surged 38.91% to $2.82 billion, according to data from CoinMarketCap.


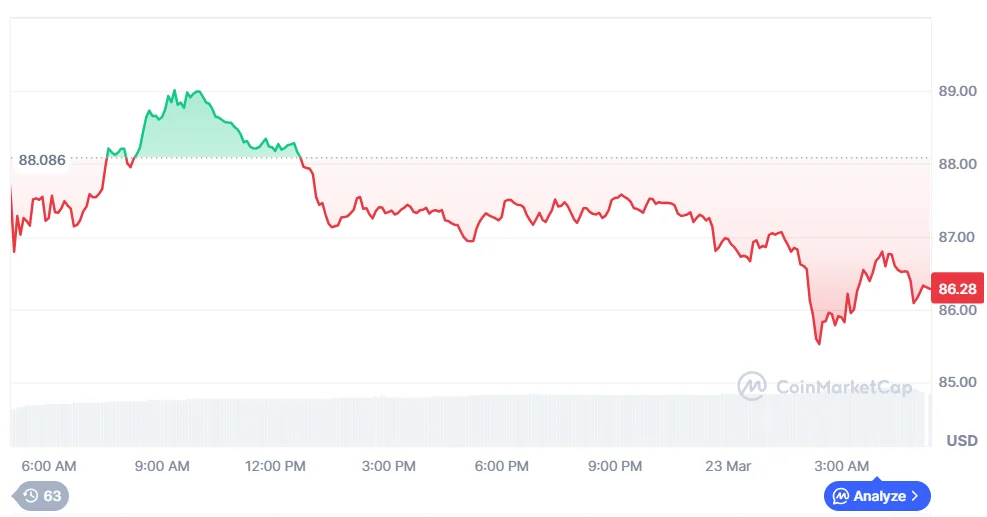
Over the past seven days, Solana has dropped 6.94%, reflecting growing bearish pressure across the broader crypto market. The combination of declining price and rising volume suggests heightened market participation, often associated with increased volatility and positioning by both buyers and sellers.
For traders, this signals a pivotal moment where holding or losing support could significantly impact short-term sentiment and price direction.
Failed Breakout at Upper Channel Boundary
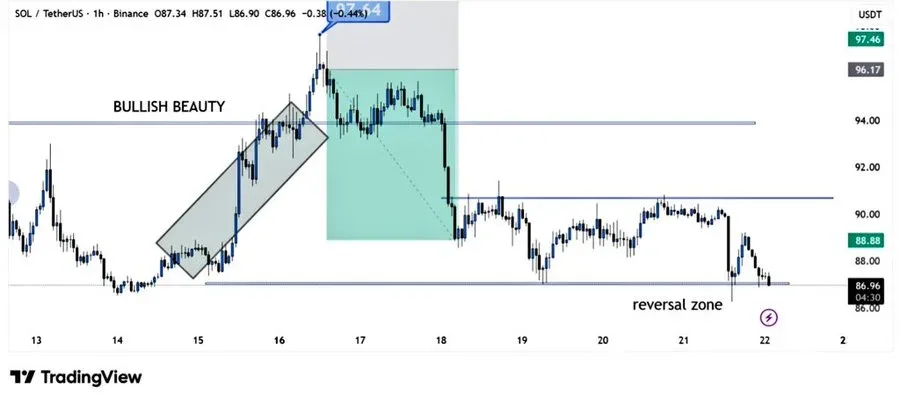
According to crypto analyst BitGuru, Solana is currently testing a crucial support range between $86 and $87 following a sharp downward move. In a recent market update shared on X, the analyst noted that buyers are attempting to defend this zone, which previously acted as a strong demand area.
A successful hold could push SOL back toward the $90 resistance level, while a breakdown may trigger further downside before any recovery. Earlier price action showed a well-defined bullish trend within an ascending channel, marked by consistent higher highs and higher lows, an indication of sustained buying pressure.
However, momentum weakened after a failed breakout near the upper boundary, where price faced a sharp rejection. This move is often interpreted as a liquidity grab or distribution phase, where larger market participants exit positions.
Following this rejection, Solana entered a consolidation phase before breaking lower, confirming a shift from bullish to bearish structure. The price now forms lower highs, and previous support levels have flipped into resistance, an important technical signal that bearish momentum remains dominant unless a clear reversal pattern emerges.

Also Read | Solana Surpasses $1.82B in Tokenized RWAs as SOL Eyes $1,000 Rally
Solana Price Trend Remains in an Ascending Channel
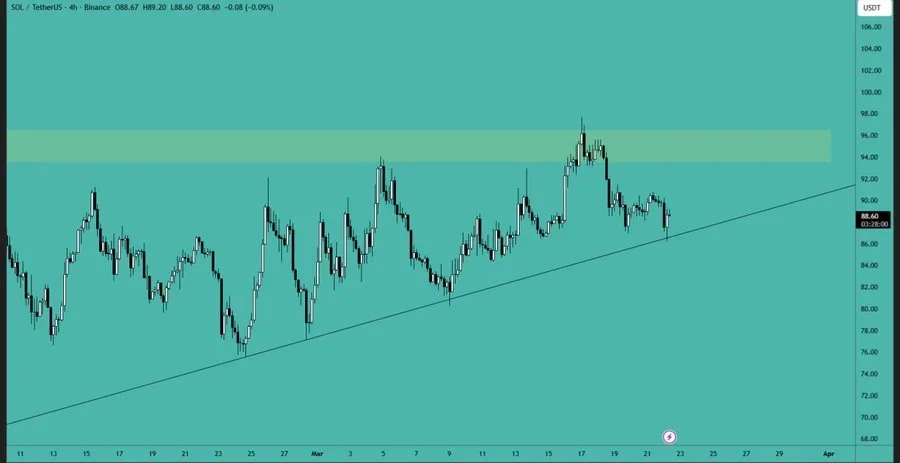
Additional analysis from ESTILO CRYPTO highlights that Solana is still trading within a broader ascending structure on the four-hour chart, supported by a rising trendline. This trendline has consistently held during recent pullbacks, indicating that buyers are still active despite the recent decline.
However, SOL is once again testing this dynamic support, placing the market at a decisive inflection point. On the upside, a strong resistance zone between $94 and $98 continues to cap price movement.
Multiple rejections from this range suggest significant selling pressure, preventing a sustained breakout. As a result, price action is compressing between rising support and horizontal resistance, a pattern often associated with an impending volatility expansion.
If the trendline holds, Solana could attempt another move toward resistance, with a potential breakout if buying pressure strengthens. However, a decisive breakdown below the $86 level would mark the first clear structural weakness, potentially opening the door for deeper losses toward the mid-$80 range.

This article contains market analysis and price predictions. These are not guarantees. Crypto markets are volatile. Always DYOR. Not financial advice.
Also Read | Solana (SOL) Eyes Breakout if Bulls Reclaim $95 Level

Be the first to comment