


What to know:
- Solana is closely watched for a key monthly bullish signal emerging soon.
- Previous SOL rallies were triggered by monthly bullish engulfing candles, leading to massive gains.
- RSI is low and SOL trades below major moving averages, indicating potential short-term weakness.

Solana is under pressure as investors await a key monthly chart signal that has historically preceded a major rally. Analysts believe that this pattern is likely to be the next major up move. Investors are looking to SOL for support during the volatility.
At the time of writing, Solana (SOL) is trading at $89.33, with a 24-hour trading volume of $ 6.95 billion and a market capitalization of $ 51.64 billion. Over the last 24 hours, SOL has declined by 1.05%. Investors are observing the monthly chart for a potential signal that could spark the next major rally.


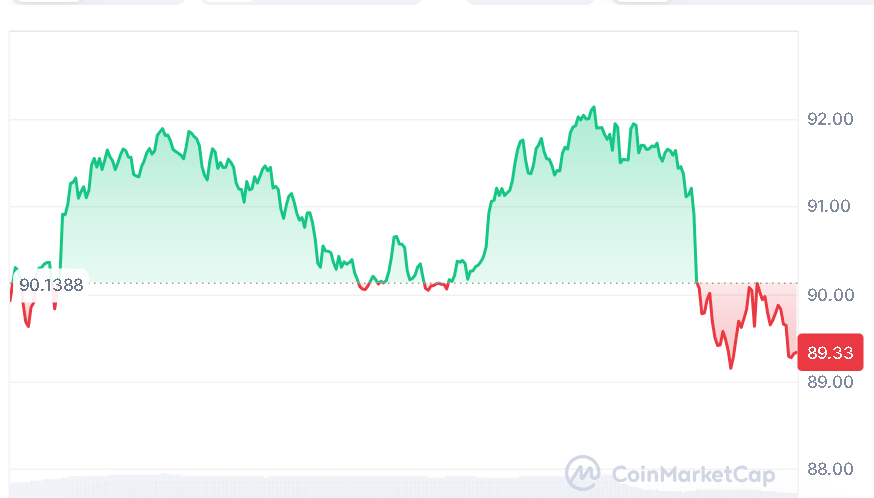
Source: CoinMarketCap
Solana Monthly Candle Sparks Rally
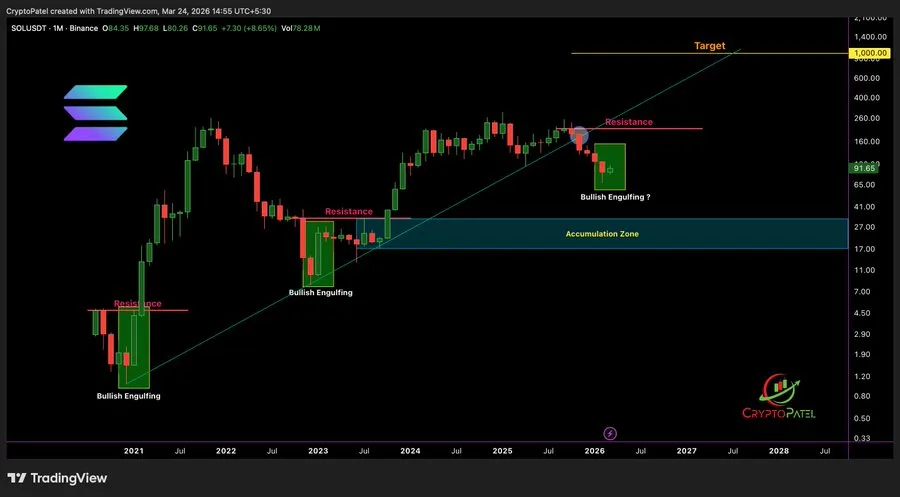
On March 24, 2026, a crypto analyst, Crypto Patel, pointed out that all significant SOL price rallies are initiated by a monthly bullish engulfing candle. This shows significant price momentum.

Source: Crypto Patel’s X Post
These rallies include the increase in the SOL prices in 2020, rising from $1.03 to $260, representing a 252x move, and in 2022, rising from $8 to $296, representing a 37x move.
As stated by Patel, the monthly candle is essential to start the price rally for SOL. Therefore, SOL has the potential to increase tenfold from its current price and reach $1,000.
Technical Indicators Warn Solana Investors
Despite all this potential, Solana still faces a lot of technical challenges. The relative strength index (RSI) is at 35.44%, which shows that there is little buying in the market, and the price is trading lower than all major moving averages: $111.71, $152.40, $160.64, and $104.11.

Source: TradingView
The Moving Average Convergence Divergence Indicator also indicates that the stock is likely to face difficulties, as the MACD line stands at -1.26, which is lower than the signal line at -20.88, and the histogram is also negative at -22.15.
Also Read | RENDER Price Analysis: $2.71 Break May Signal Trend Shift
Investors Eye Solana Monthly Bullish Signal
The attention of investors and enthusiasts alike is focused on the monthly bullish engulfing candle highlighted by Patel. While current technical indicators suggest further weakness, a signal like this may be the start of a major upward trend. Until such a signal occurs, observation is recommended as SOL continues to look for a support level.
This article contains market analysis and price predictions. These are not guarantees. Crypto markets are volatile. Always DYOR. Not financial advice.
Also Read | Ethereum Accumulation Sparks Momentum: Could ETH Reach $20,000 Next Cycle?

Be the first to comment