


What to know:
- Solana (SOL) rejected at $93, now consolidating near the critical support range of $82–$84.
- Weak buying interest and bearish technical indicators suggest potential short-term downside movement for SOL.
- The Relative Strength Index at 42.66 and the MACD negative confirm declining momentum in the Solana market.

Solana (SOL) is currently facing a significant resistance level, where recent attempts to rise above it have been unsuccessful. Buyers are trying to hold the price near a significant support level. However, the overall trend is unclear, indicating a volatile upcoming period.
At the time of writing, Solana (SOL) is trading at at $83.71 with a trading volume of $4.11 billion and a market capitalization of $47.98 billion, based on data from CoinMarketCap. In the last 24 hours, the price of Solana has increased by 0.62%, and the market is trading cautiously after the rejection.
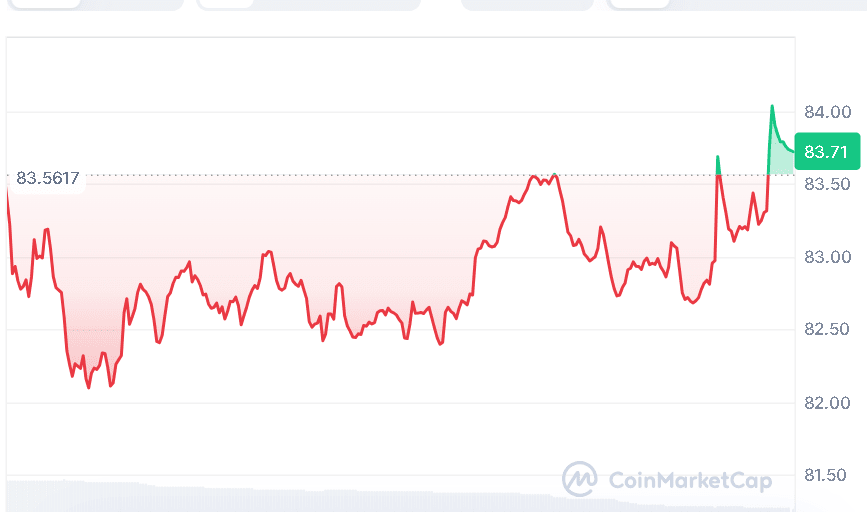

Source: CoinMarketCap

Solana Breakout Fails Amid Weak Demand
As crypto analyst BitGuru explained in his post on X (formerly Twitter) on March 28, 2026, “SOL has recently made a move to break the $93 resistance level, which it has not been able to sustain. This has brought a shift in the short-term structure of the market, with the selling pressure sending the asset back down to the lower support zones.”
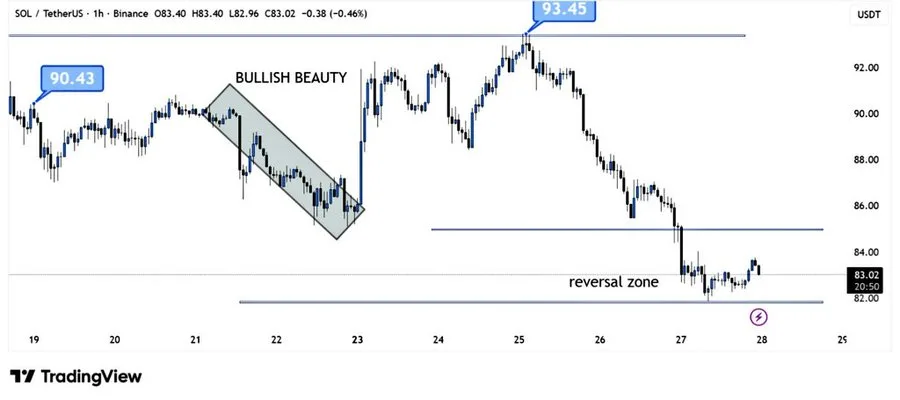

Source: BitGuru’s X Post
Currently, the price of SOL is near a critical support level of $82-$84. Investors are closely observing this level of the price of SOL as the buyers are trying to hold the price at this level. However, it would be tough to hold the price at this level as there are no strong buying signals.
Solana Indicators Signal Strong Bearish Momentum
Technical indicators are also reflecting this lack of strength, as the Relative Strength Index currently stands at 42.66, which is still below the 50-level and therefore doesn’t reflect sufficient buying strength. This reflects a reduction from its previous position, which was closer to 51.14.
In addition to this, SOL is currently trading below its Moving Average “ribbon.” It is facing resistance at levels of $86.10 and $88.67 for its potential to rise. The presence of moving averages at levels of $105.77 and $141.91 is also a reflection of this trend.

Source: TradingView
The Moving Average Convergence Divergence indicator also shows bearish bias. The MACD is still in the negative area, with the signal line reading -0.57470, while the MACD line reads -0.59828. The histogram reads -0.02358, but it does not yet show the buy signal.
Also Read | Solana (SOL) Developer Growth Surges, Price Momentum Points to $90 Target
Solana Struggles With Bears
Overall, the price action of Solana appears to be consolidating with a bias towards the bears. It has been recommended that while the support level might hold up for a while, the absence of buying interest might cause the asset to trade sideways or fall in the near future.
This article contains market analysis and price predictions. These are not guarantees. Crypto markets are volatile. Always DYOR. Not financial advice.
Also Read | Morgan Stanley Launches Low-Fee Bitcoin ETF, Challenging Competitors and Investors

Be the first to comment