


What to know:
- SOL rebounds but stays capped below $92, keeping structure range-bound amid a weak trend.
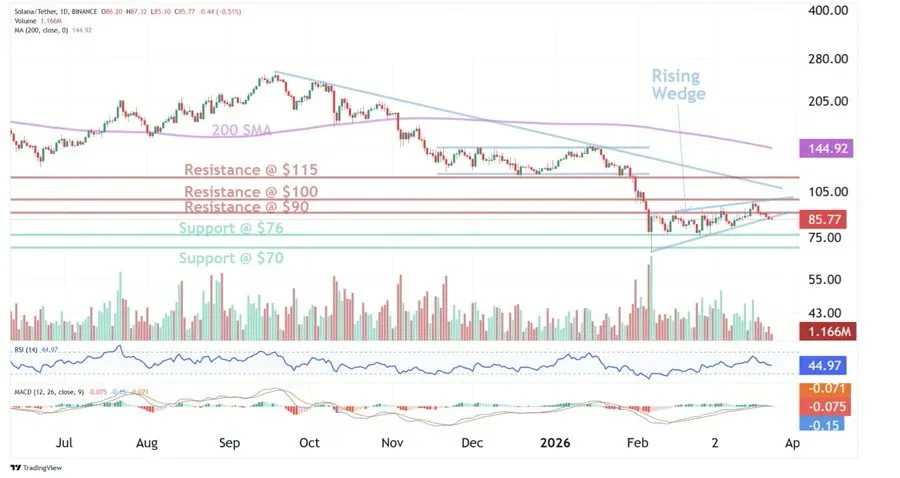
- A rising wedge signals downside risk, with $76 and $70 supports in focus on breakdown.
- EMA and RSI show weak momentum as derivative activity rises with a slight bullish bias.


On Tuesday, March 24, Solana (SOL) posted a modest rebound after a recent decline, but the price remained capped below a key resistance level. The broader structure stayed range-bound as buyers failed to push SOL above the $92 zone.
As of press time, SOL is trading at $91.59, marking a rise of 5.7% in a day. The trading volume is showing a strong bullish surge up 100.56% and is currently standing at $5.52 billion. Over the past week, the SOL coin price has gone down by 3.6%, according to CoinMarketCap.

SOL Faces Breakdown Risk as Wedge Forms
CoinCodeCap Trading, an analyst, highlighted that SOL is forming a rising wedge pattern in a larger downtrend. This is usually a continuation pattern to the downside.
The analyst noted that the overall momentum is mildly bullish but not strong enough to break the downtrend. A break below will likely result in a move to $76 and $70. A break above $100 will shift the outlook and target $115.

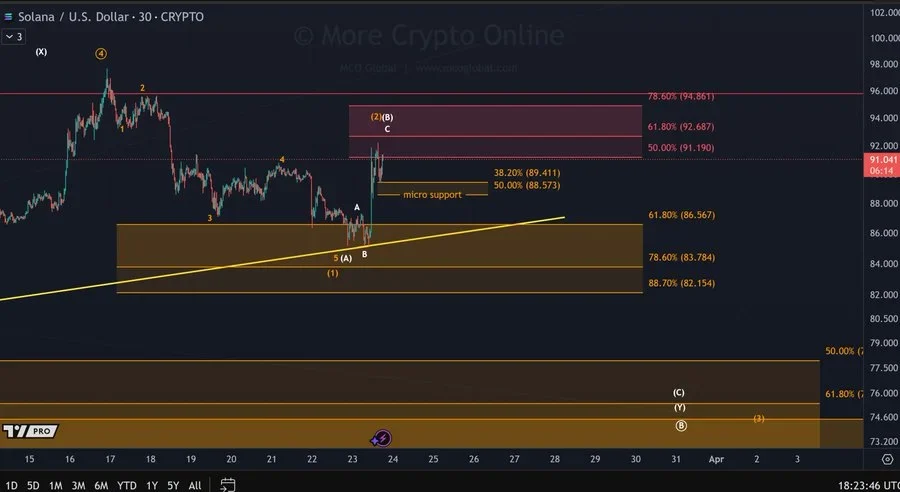
Moreover, another analyst, More Crypto Online, has also mentioned the SOL movement as a three-wave bounce up into resistance. The analyst noted that another push-up might happen.
However, early signals of a possible top are emerging below the $88.5-$89.4 range. The next resistance levels might be at $92.7-$94.8, which may limit further upside.

Volume and Open Interest Climb
CoinGlass data shows rising derivatives market activity. Volume increased by 89.12% to $16.92 billion. Open interest has gone up by 4.58% to $5.09 billion. The OI-weighted funding rate is at 0.0015%, showing a slightly positive bias.
Also Read: Solana Breaks Support as Head and Shoulders Signals Downside Toward $70
SOL Trend Weakens as EMAs Cap Further Upside
The Exponential Moving Averages (EMA) indicated stabilization over the short term but overall weakness. The 20-day EMA is at $88.74. SOL was trading above this level.
This indicates that there is support for the token over the short term. The 50-day EMA sits at $93.17. This indicates that there is resistance immediately above the current level.
The longer-term EMAs are still significantly above the current level. The 100-day EMA is at $107.14, and the 200-day EMA stands at $127.99. This shows that the token is still trading below major trend indicators.
The EMA configuration remained bearish, with short-term EMAs trading below long-term counterparts. This continued to reflect a bearish trend. The price action below the 50, 100, and 200 EMAs indicated that the price is experiencing limited upward strength at these levels.
The Relative Strength Index (RSI) indicated mild strength without strong momentum. The RSI is at 54.14. The RSI moving average is at 51.86. These levels remained slightly above the neutral level. This indicated mild buying pressure without strong overbought conditions.
This article contains market analysis and price predictions. These are not guarantees. Crypto markets are volatile. Always DYOR. Not financial advice.
Also Read: Ethereum Holds Crucial $2,080 Support as Market Signals Hidden Accumulation
Be the first to comment