


What to know:
- Solana (SOL) struggles below the $82–$86 resistance, signaling ongoing bearish pressure in the market.
- Technical indicators show sellers in control, with RSI at 37.56 and MACD still negative.
- Investors are watching key support levels closely to gauge potential recovery or further declines.

Solana is showing signs of weakness as the market is facing downward pressure. Analysts say the next price bounce will be a crucial indicator in the direction the market will take. Technical indicators show the sellers in control, with no sign of a reversal.
At the time of writing, Solana (SOL) is trading at $78.88, with a trading volume of $9.59 billion over the last 24 hours. Its market capitalization is valued at $45.37 billion. Over the last 24 hours, SOL has seen a decline of about 5.17% as selling pressure continues in the crypto market.
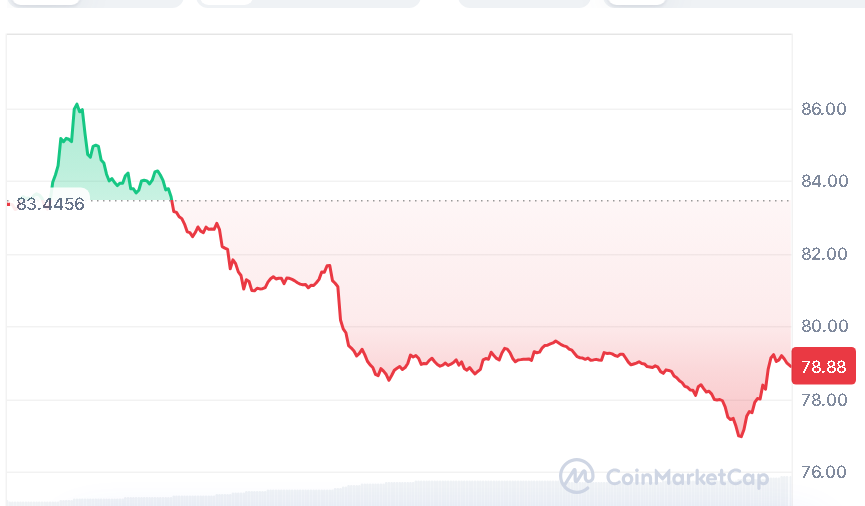
Source: CoinMarketCap

Also Read | XRP Price Down Nearly 30% in 2026: $1 Support Level in Focus
Solana Faces Pressure Before Rebound
On April 2, 2026, a crypto analyst, More Crypto Online, pointed out the following in relation to Solana’s price movement: Solana’s price continues to move lower, and the trend remains the same as in the last updates.
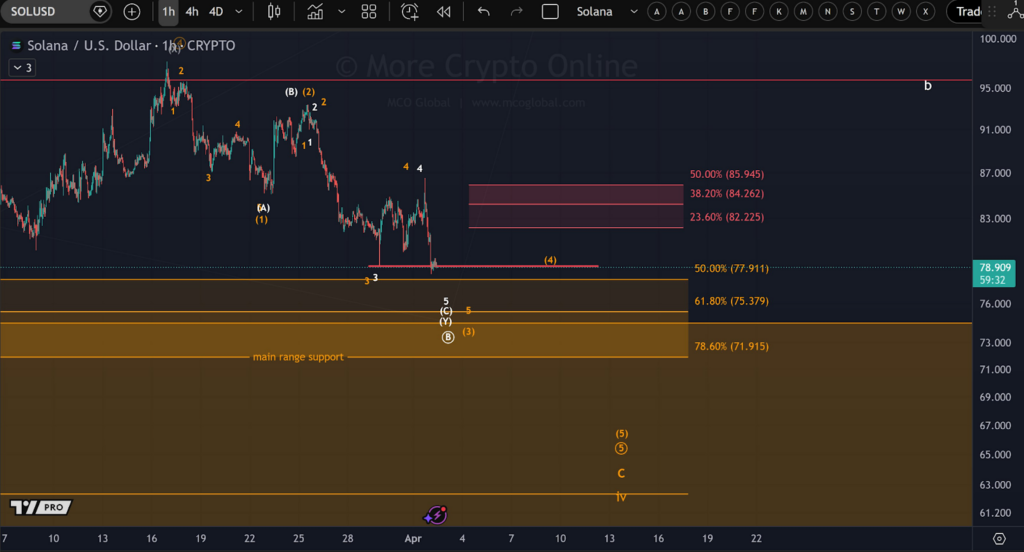
Source: More Crypto Online’s X Post
However, the next bounce will be a crucial one to define the direction in the short term. For the time being, the resistance zone for SOL lies in the area between $82.22 and $85.94.
Solana Bears Dominate Technical Signals
Solana is currently trading below its moving average (MA) Ribbon, which means the market is biased towards the bearish trend. Short-term support and resistance are represented by the 20-day simple moving average (SMA) at $87.34, the 50-day SMA at $85.75, which is currently above the stock’s price. Long-term support is represented by the 100-day SMA at $103.55 and the 200-day SMA at $138.05.
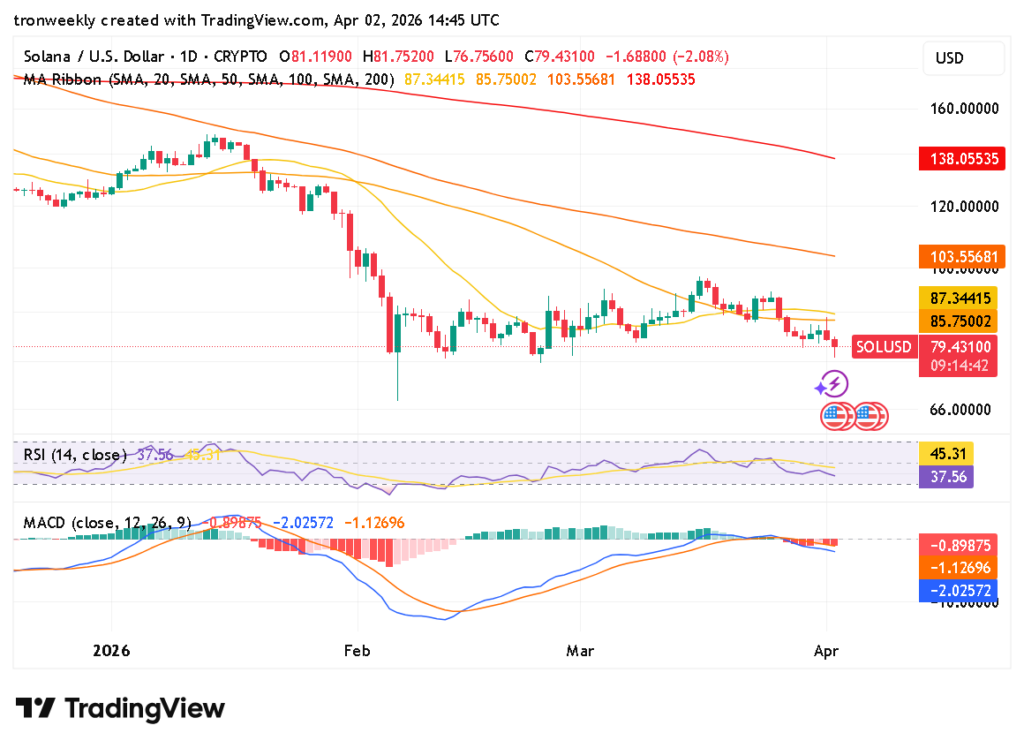
Source: TradingView
The Relative Strength Index (RSI) is currently at 37.56, which is below its signal line at 45.31. This shows weak buying activity and the continued dominance of sellers. The MACD is still negative, as indicated by the MACD line at -2.02, which is still below the signal line at -1.12.
However, the histogram is shrinking at -0.89, which may suggest a decrease in selling pressure. This may suggest a consolidation phase, but a bullish reversal is still pending.
Solana Approaches Critical Levels
Investors are closely tracking the behavior of SOL in the coming sessions. If SOL can recover and bounce back from these support levels, then there will be more clarity on whether SOL can recover and regain momentum or not. Otherwise, there will be more declines in SOL.
Overall, the market is at a critical point, and short-term price fluctuations will determine the trend of the Solana coin in the coming weeks. Investors should be careful about the resistance and support levels, as they would be significant in determining the trend of the coin.
This article contains market analysis and price predictions. These are not guarantees. Crypto markets are volatile. Always DYOR. Not financial advice.
Also Read | Lab-Grown Diamonds Reshape the Market as Prices Fall 80%

Be the first to comment