


What to know:
- Stellar (XLM) is consolidating sideways, showing weak momentum and no significant low formation.
- Key support levels range from $0.108 to $0.139, while resistance sits at $0.185.
- Technical indicators (MA Ribbon, RSI 45.87, MACD) suggest continued low momentum and selling pressure.

Stellar (XLM) price is moving sideways within the cryptocurrency market, failing to form any significant lows. Market players are observing crucial support and resistance levels, as this will determine the future movement of the digital asset in the coming days.
At the time of writing, Stellar (XLM) is trading at $0.1618, with a 24-hour trading volume of $93.05 million and a market cap of $5.36 billion, according to CoinMarketCap. The XLM has declined slightly by 1.41% over the last 24 hours, reflecting a period of consolidation after recent corrective movements.
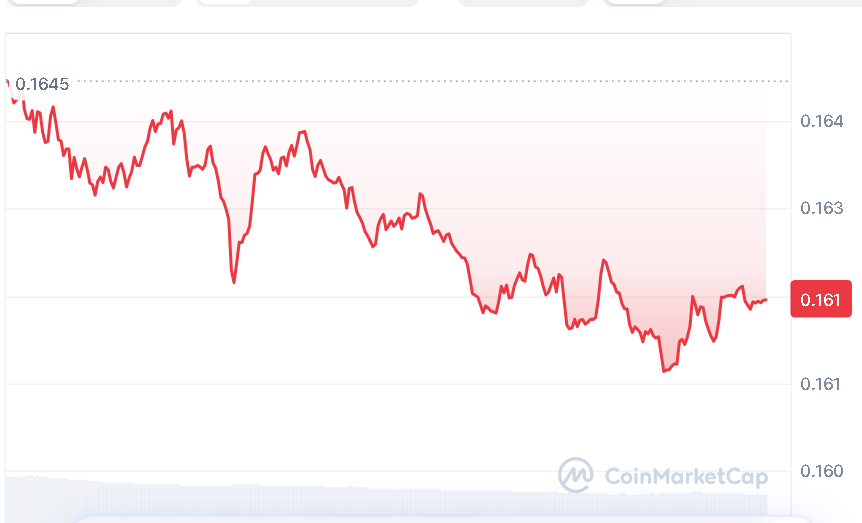
Source: CoinMarketCap

Also Read | WLD Price Prediction: Will This 98% Dip Turn Into the Next Bull Run?
Stellar (XLM) Price Tests Resistance
On April 4, 2026, the renowned crypto analyst, More Crypto Online, highlighted that the price of XLM continues to remain range-bound without any sign of the formation of its bottom. The movements made following the lows experienced in February and March can be regarded as corrections.
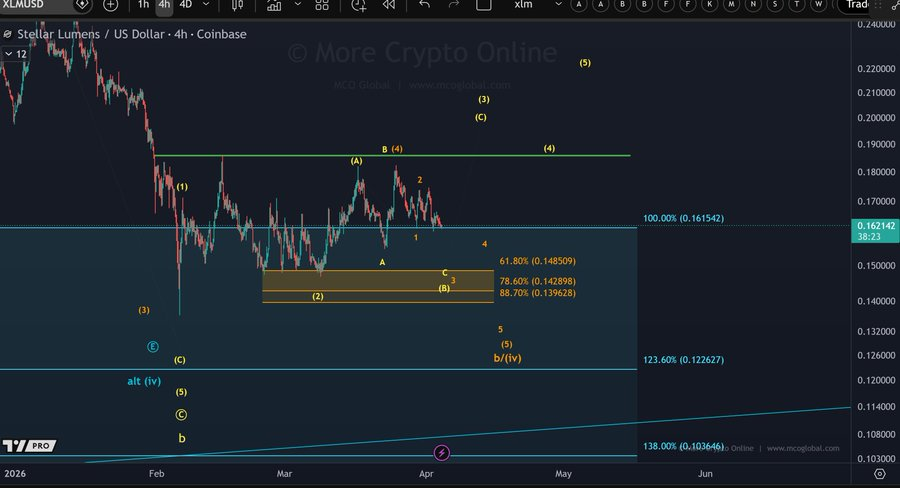
Source: More Crypto Online’s X Post
According to More Crypto Online, the breakout above the resistance of $0.185 will be needed to indicate a sign of turnaround in Stellar’s favor. Until then, there exists a possibility that XLM could fall further down, possibly testing the support levels of $0.122 or $0.108. On the upside, the current range of support stands at $0.139-$0.148.
XLM Shows Weak Momentum Signals
The XLM is currently trading at $0.16198 and trading below all the levels of the MA Ribbon at $0.16759, $0.18326, and $0.23946. This shows that the trend’s strength is quite weak. The short-term moving average is currently at $0.16262 and is also very close to the stock price, showing that the stock is consolidating.
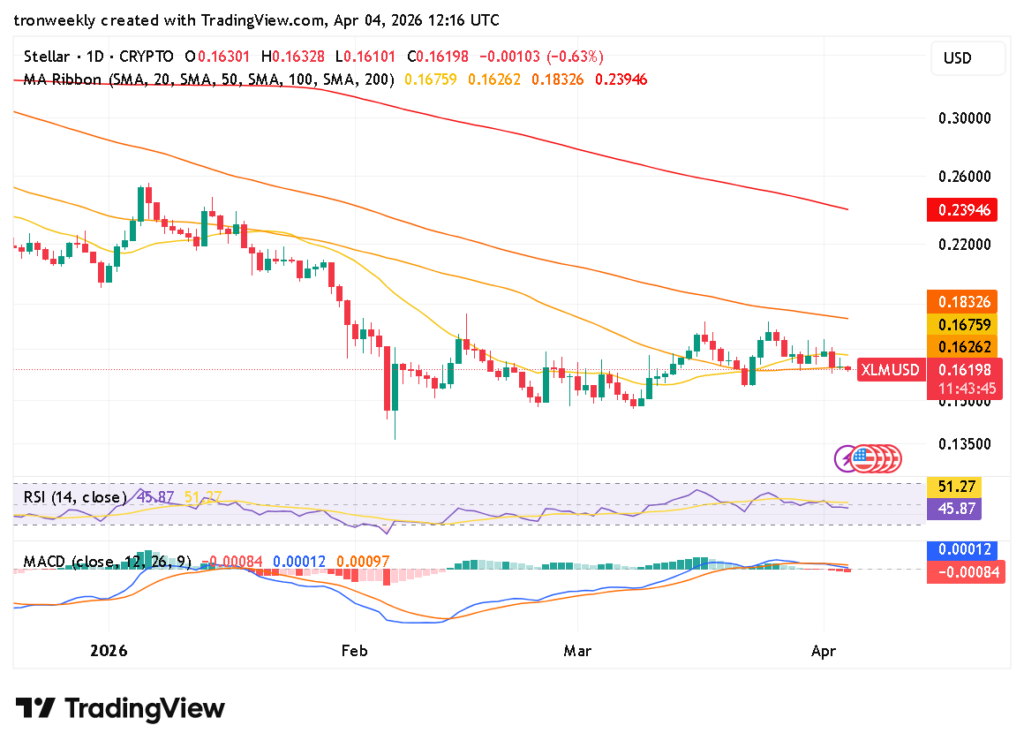
Source: TradingView
The RSI value is 45.87, while the signal line value is about 51.27, indicating that the momentum is weak but not bullish.
The MACD also exhibits weak momentum, as the MACD Line is at 0.00012 and the Signal Line is at 0.00097. The histogram comes in negative territory with a value of -0.00084, signaling continuous selling activity. The two lines have converged, suggesting low momentum.
This article contains market analysis and price predictions. These are not guarantees. Crypto markets are volatile. Always DYOR. Not financial advice.
Also Read | XLayer (OKB) Remains Under Pressure Despite Kraken Exchange Listing

Be the first to comment