


What to know:
- SUI is testing the crucial $0.95 support, with the potential to rebound toward $1.00–$1.04.
- Weak momentum and bearish technical indicators are keeping selling pressure on the market.
- Key resistance levels near $0.957–$0.981 may limit upside until momentum improves.


SUI is facing a critical test as it struggles to maintain the $0.95 support level after the latest dip in the market. The momentum of the cryptocurrency has weakened, as indicated by the market, which could either mean the token stabilizes or continues going downward. The next few hours are critical as the market determines the fate of SUI.
At the time of writing, SUI is trading at $0.9469, with a 24-hour trading volume of $524.37 million and a market capitalization of $3.70 billion. Over the last 24 hours, the cryptocurrency has slipped by 4.4%, highlighting the ongoing challenging market conditions.


Source: CoinMarketCap
SUI Approaches Key Support Zone
On March 19, 2026, popular crypto analyst BitGuru stated that SUI is currently testing the $0.95 support zone after failing to break through the $1.07 resistance level.
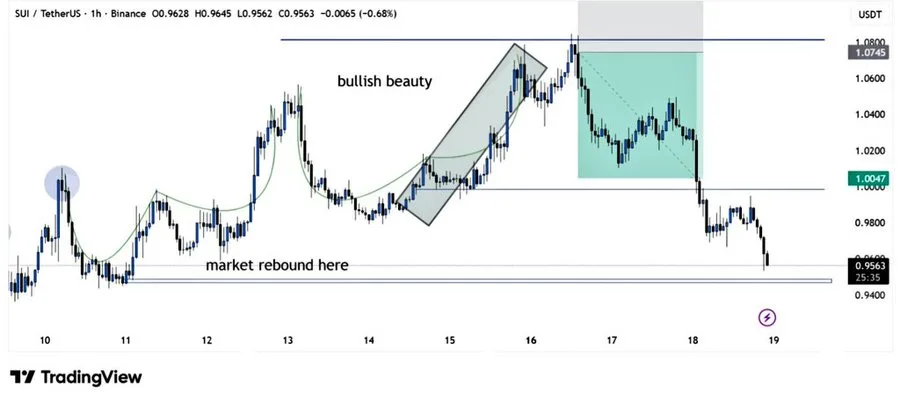

Source: BitGuru’s X post
Holding this support level may cause the price to rebound to the $1.00 to $1.04 price range. On the other hand, if this support fails to hold, it may cause the price to fall even lower.
Weak Momentum Keeps Pressure on SUI
From the technical indicators, it is evident that SUI is failing to gain strength as the Relative Strength Index (RSI) is around 45.77, and the price is still below the moving average (MA) ribbon.
The averages at 0.95718 and 0.98124 have become resistance levels, and the higher MA levels at 1.27886 and 1.39366 indicate that the overall trend is still in decline.
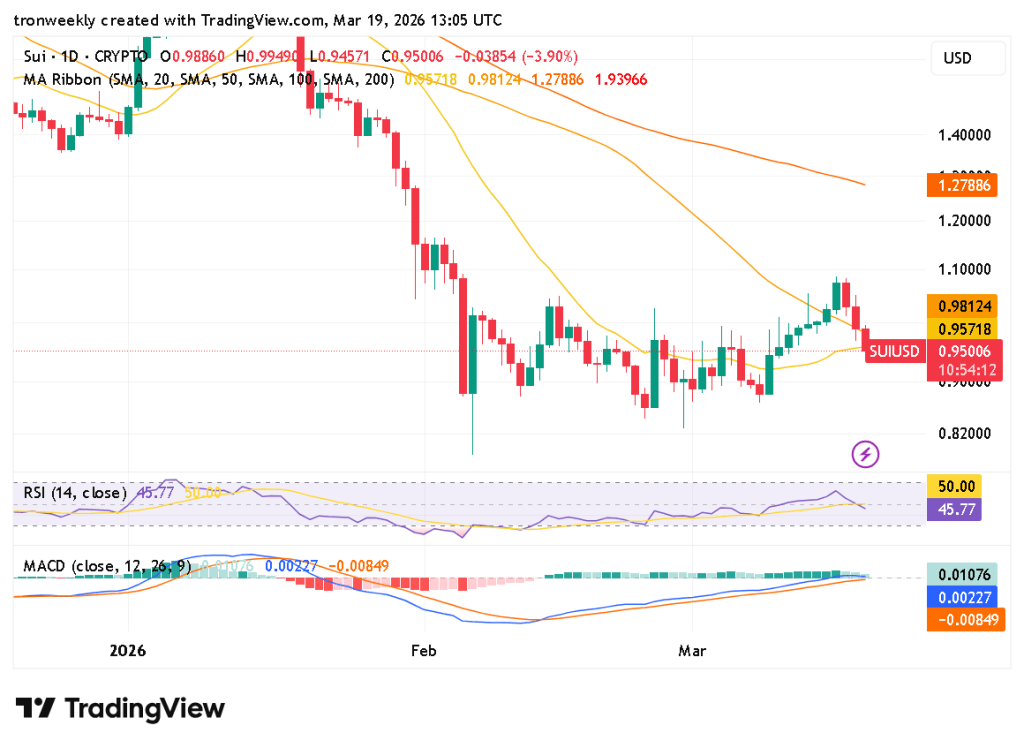
Source: TradingView
The Moving Average Convergence Divergence (MACD) indicator also supports the bearish view. Although the line at 0.00227 is rising, it is losing momentum relative to the signal line at -0.00849.
Moreover, the histogram at 0.01076 shows declining momentum. It shows that the buying pressure is weakening, and the market might either consolidate or decline before any uptrend.
Also Read | ASTER Price Prediction: Could $0.80 Breakout Push The ASTER Toward $0.90?
Pivotal Support Challenges SUI Price
Overall, SUI is at a pivotal level. It has the potential to bounce back if it holds the support at the $0.95 level. However, the technical signals suggest the cryptocurrency is facing headwinds as the momentum remains subdued.
This article contains market analysis and price predictions. These are not guarantees. Crypto markets are volatile. Always DYOR. Not financial advice.
Also Read | FARTCOIN Hits $0.22 Resistance: Is a Pullback About to Start?

Be the first to comment