


What to know:
- SUI stabilizes near $0.89–$0.90 support after rejection, signaling potential short-term recovery.
- Buyers may push the price toward $0.96–$0.98 if momentum strengthens.
- RSI near 48 shows consolidation, while MACD indicates weak bullish strength.


SUI has stabilized near an important support point, after its volatility. An important short-term range has been identified due to the downward pressure. SUI is trading above an important point, and a relief move is expected if more buying pressure is added. No uptrend is observed in the technical levels.
At the time of writing, SUI is trading at $0.9669 with a 24-hour volume of $764.15 million and a market capitalization of $3.72 billion. According to CoinMarketCap, SUI has gained 4.83% over the last 24 hours, indicating a cautious upward trend.


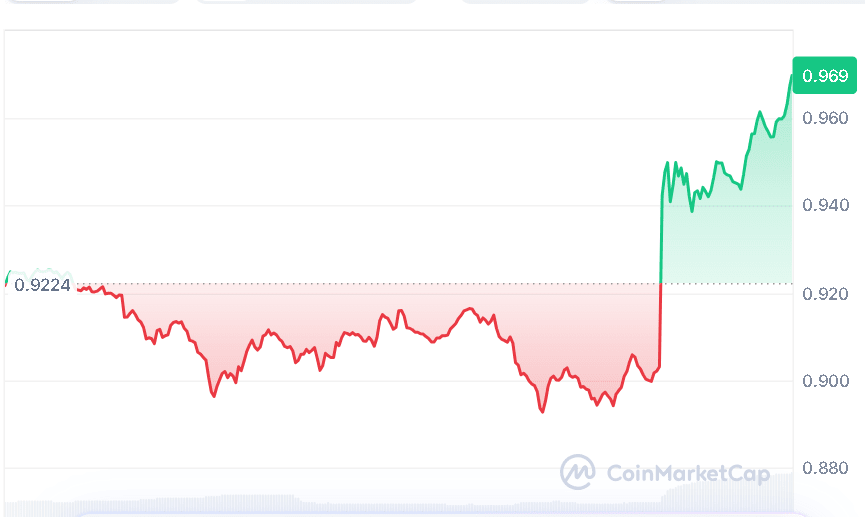
Source: CoinMarketCap
SUI Stabilization Hints At Short Recovery
In his analysis on March 23, 2026, crypto analyst BitGuru stated that SUI still maintains a short-term downtrend; however, it has found some stability at the price range of $0.89 to $0.90.
This range has become a significant demand zone because the token faced significant rejection at the higher price levels. This shows that the selling pressure was unable to push the token to lower levels.

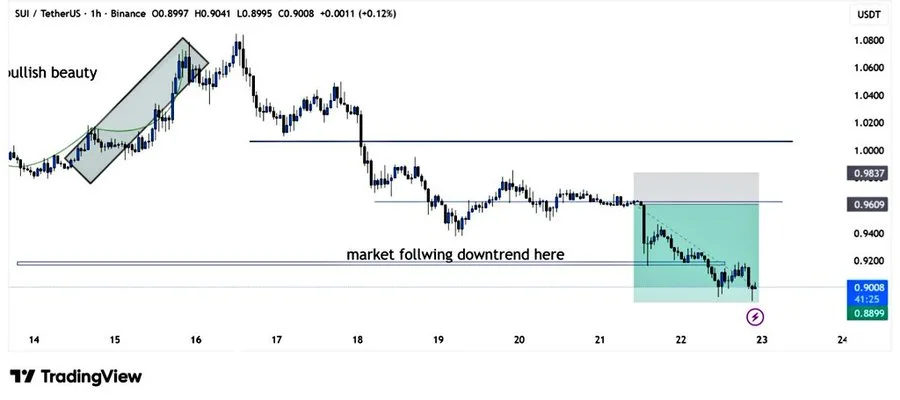
Source: BitGuru’s X Post
BitGuru continued: If there is indeed buying interest in this area, then it’s possible to see a pop back towards the $0.96 to $0.98 range. This would be a bullish sign in terms of sentiment in the short term, and this range may indeed attract some investors’ attention as a potential entry point.
This is a significant area in which to hold up, which would prevent any further downward pressure and set the stage for a potential move upward in the short term.
SUI Consolidates As Indicators Show Weakness
At present, SUI is trading at $0.96, with a Relative Strength Index (RSI) of 48.29, which is close to the mark of 50. This indicates a balanced condition, as there are neither buyers nor sellers in the market, which means consolidation.
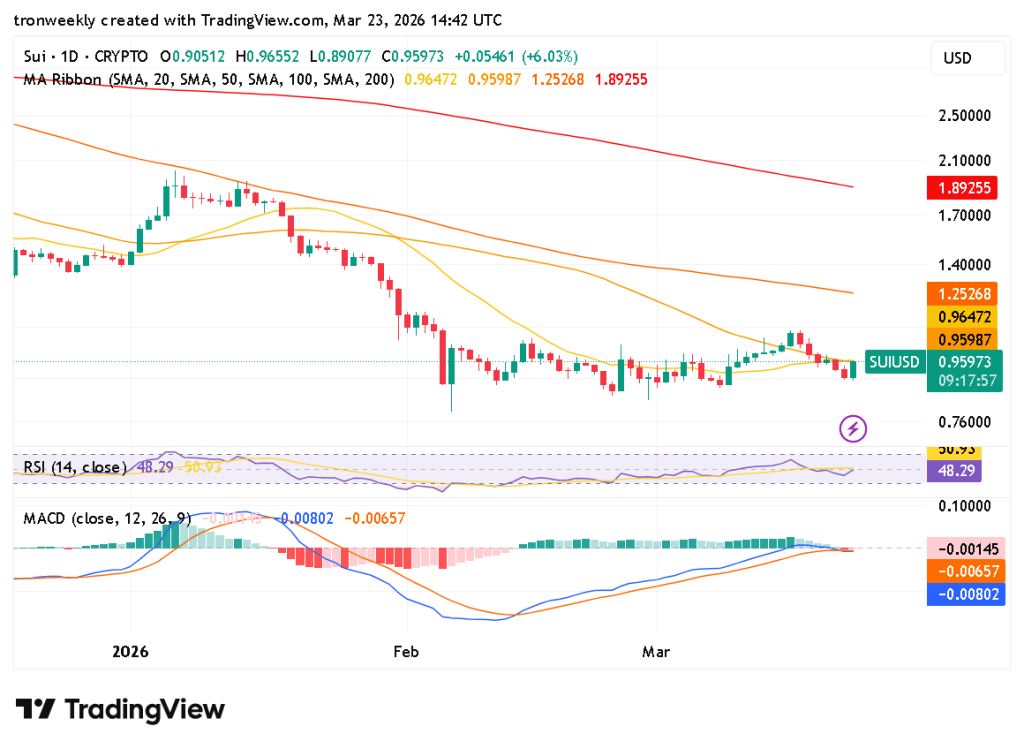
Source: TradingView
The technical indicators are still showing a cautious trend. The Moving Average Ribbon indicates that there are levels of resistance above the current price at $0.96472 and $0.95987. Other levels of resistance are at $1.25 and $1.89.
The MACD indicator suggests that the power of the bulls is weakening, as the MACD line currently stands at -0.00802, the signal line at -0.00657, while the histogram stands at -0.00145.
Also Read | XRP Momentum Fades After Breakdown, Sellers Tighten Grip
SUI Holds Support Eyes Breakout Move
Overall, it appears that SUI is stabilizing as a result of the recent price fluctuations, with the $0.89-$0.90 support zone continuing to be a significant price point for the short-term trend of the asset.
Investors are watching closely to see if SUI will be able to maintain this support zone and push towards even higher resistance, which will be a clear indication of future price growth.
This article contains market analysis and price predictions. These are not guarantees. Crypto markets are volatile. Always DYOR. Not financial advice.
Also Read | Internet Computer (ICP) Price at Risk: $2.30 Support Could Decide Next Move

Be the first to comment