


What to know:
- GRT is testing a critical support zone near $0.02–$0.03 amid declining volume.
- Analysts highlight a falling wedge pattern signaling potential rebound conditions.
- A confirmed breakout remains essential to shift the long-term bearish trend.

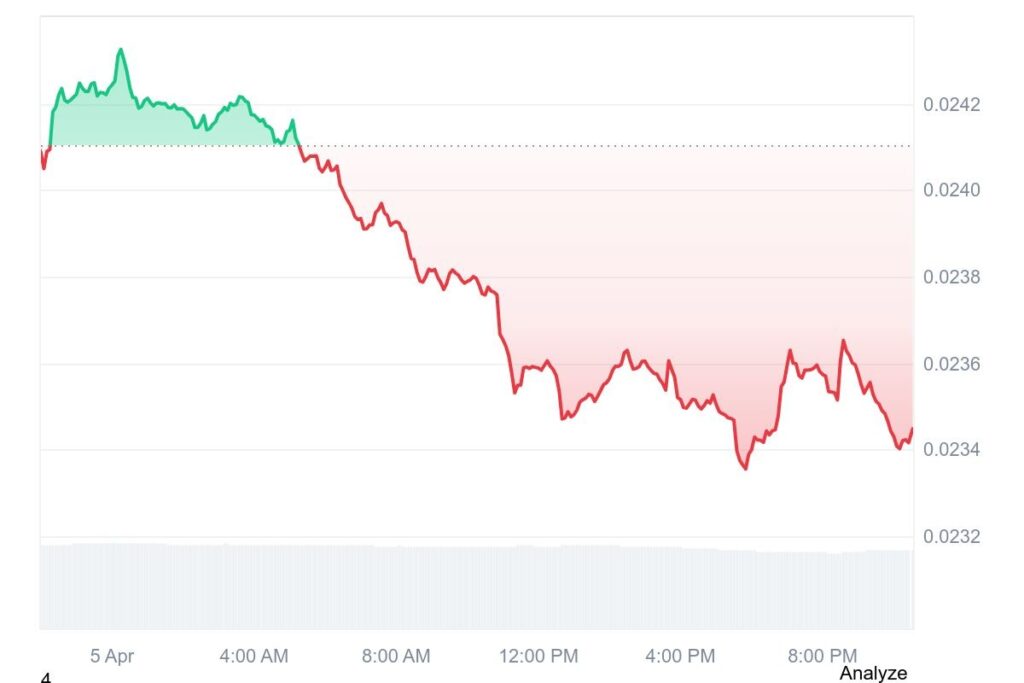
The Graph (GRT) is currently trading at $0.02344 as of the April 2026 session, reflecting a 3.21% decline over the past 24 hours, while daily trading volume has dropped 6.73% to $16.81 million.
The decline in participation suggests reduced short-term momentum across the market, even as price action compresses near a historically significant technical zone. Despite intraday weakness, GRT has recorded a 0.42% gain over the past seven days, indicating early stabilization after a prolonged downtrend.
The token is now approaching a critical support range between $0.02 and $0.03, an area repeatedly identified in prior market cycles as a demand zone where buyers have previously stepped in.

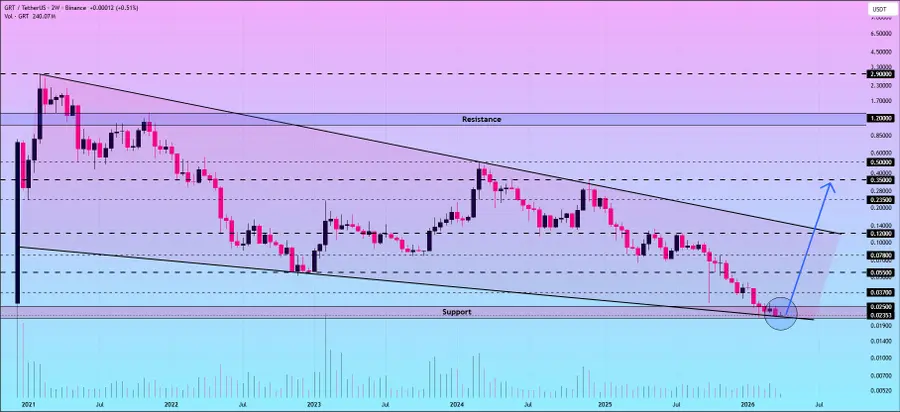
Capitulation Phase Signals in GRT Consolidation
In a recent post on X, crypto analyst Profit Demon stated that GRT is consolidating within a long-term falling wedge pattern on the two-week chart.
This structure, formed by consistent lower highs and lower lows since the 2021 peak, reflects a prolonged bearish trend but also signals weakening downside momentum. The analyst identified potential upside targets at $0.037, $0.055, $0.078, $0.120, $0.235, and $0.35 if a rebound occurs.
Repeated rejections from the upper trendline indicate strong selling pressure, while consistent buying near support suggests ongoing accumulation. The recent move into the lower boundary may represent a capitulation phase, which is often observed before a short- to mid-term recovery.
However, analysts caution that any upward movement would remain a counter-trend rally unless GRT breaks above key resistance levels and establishes higher highs. The $0.12 level is seen as a critical resistance zone, aligning with previous consolidation and trendline resistance.
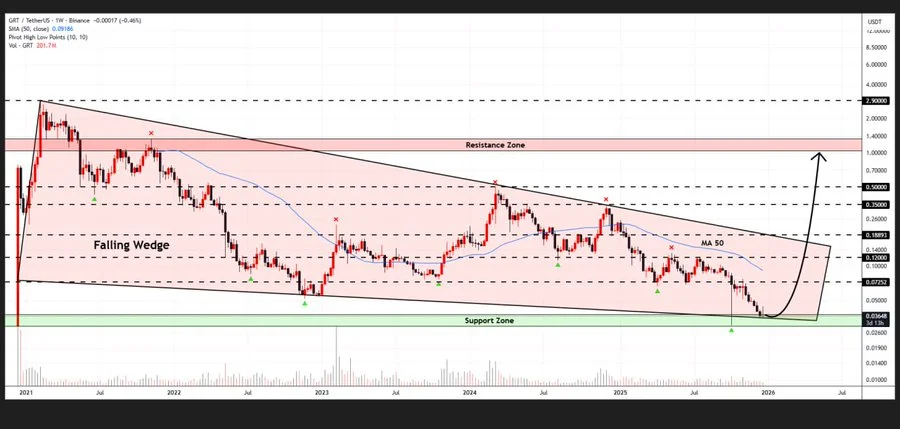
Descending Triangle Formation on the Graph
Another crypto analyst Whales_Crypto_Trading highlights a similar setup on the weekly chart, where The Graph is testing the lower boundary of a descending triangle or wedge-like formation. The pattern suggests that bearish momentum is gradually weakening as price compresses toward its apex.
While the broader trend remains negative, as indicated by a downward-sloping moving average, there are early signs of seller exhaustion near current levels. Analysts suggest that a successful defense of support could lead to a stronger upward move, although projections as high as $1.0 remain speculative and dependent on broader market conditions.
Failure to hold this support zone would invalidate the bullish setup and could push GRT into further downside, potentially entering a new price discovery phase below historical support levels. As the pattern matures, market participants are closely watching for confirmation of either a breakout or breakdown.
This article contains market analysis and price predictions. These are not guarantees. Crypto markets are volatile. Always DYOR. Not financial advice.
Also Read | The Graph Breaks Resistance At $0.9458, Sets New Monthly High

Be the first to comment