

What to know:
- TON falling wedge breakout suggests a potential trend reversal from bearish to bullish price action.
- RSI rose to 60.35, confirming strengthening buying pressure without entering overbought territory.
- Analysts expect a possible 100% upside toward $3 if bullish momentum and support levels hold.

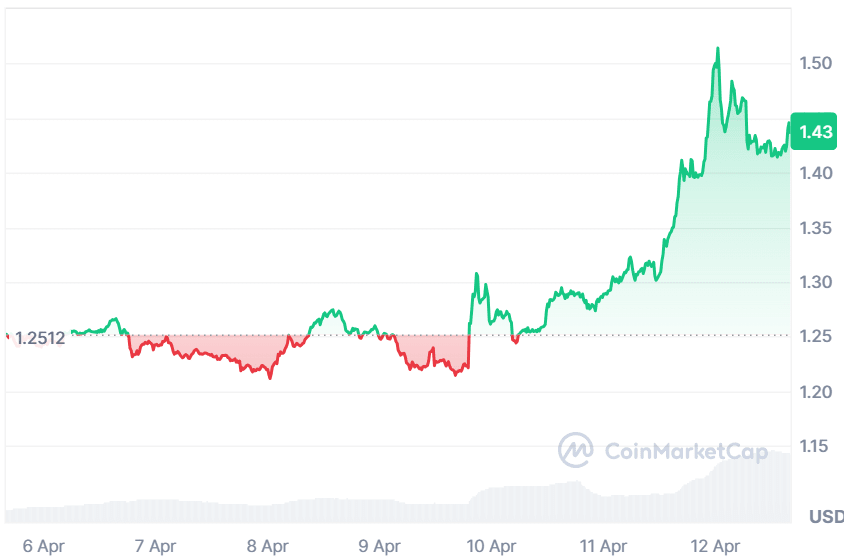
Toncoin (TON) is moving in an upward price trajectory despite the early signs of negative momentum in the overall market. According to CoinMarketCap, as of Sunday, April 12, the TON price has surged by 4% over the last 24 hours and 14.81% over the last week.
At the time of writing, TON is trading at $1.43, with a trading volume of $277.79 million, which has surged by 113.69% over the last 24 hours. However, its market capitalization stands at $3.56 billion, which has also surged by 4.14%.

Source: CoinMarketCap

Also Read: Toncoin (TON) Whale Buying and Bullish Breakout Hint at Uptrend Continuation
Toncoin Breakout Signals Potential 100% Rally
Furthermore, the crypto analyst Javon Marks highlighted that Toncoin (TON) is gaining attention after breaking out of a falling wedge pattern, a bullish technical signal that often marks the end of a downtrend.
This breakout suggests weakening selling pressure and a potential shift toward upward momentum, with traders increasingly watching for confirmation as price action begins to strengthen in the short term.

Source: Javon Marks’ X Post
With this trajectory remaining in effect, estimates suggest that TON may soar well over 100% beyond its breakout point, potentially even hitting the $3 mark.
However, such an advance depends upon strong trade volume and market conditions; otherwise, a failure to sustain above the breakout zone may weaken the case for the bull run.
TON Technicals Point to a Recovery Attempt
According to TradingView, it appears that TON revealed a bearish trend that has now shifted into an upward movement. From December 2025 to March 2026, prices have been below the moving average.
However, this will change in April 2026, as prices increase by 10% to reach $1.43 after breaking out above the upper Bollinger Band.

Source: TradingView
The technical indicators provide support for such a decisive change of direction. Firstly, the RSI surged to 60.35 from its neutral value of 44.
The RSI thus shows that there was a fast increase in buying activity without reaching an overbought level yet. This follows a Bollinger Band Squeeze pattern, which is indicative of a large breakout to come when volatility is low.
This article contains market analysis and price predictions. These are not guarantees. Crypto markets are volatile. Always DYOR. Not financial advice.
Also Read: Toncoin Price (TON) Eyes 28% Surge Amid Bearish Pressure

Be the first to comment