


What to know:
- Toncoin (TON) holds steady as buying interest returns, signaling a gradual recovery in market sentiment.
- Weekly gains reflect improving confidence and rising participation among traders across the broader crypto market.
- A falling wedge pattern indicates a potential bullish breakout if resistance levels are successfully breached.

Toncoin (TON) is showing price stability, holding its ground over the past 24 hours as buying interest begins to recover.
As of March 26, 2026, the asset reflects short-term consolidation, while posting a solid weekly gain of 2.34% amid improving market sentiment and rising trader participation.


Source: CoinMarketCap
According to the CoinMarketCap data, the token is trading at $1.32, supported by growing market activity. However, the 24-hour trading volume has declined to $79.44 million, marking a 23.49% drop.
Meanwhile, market capitalization stands at $3.27 billion, remaining stable as overall momentum begins to strengthen.
Also Read: Toncoin (TON) Eyes 28% Surge Amid Bearish Pressure
Toncoin Falling Wedge Pattern Signals Breakout Potential
Looking at the TON price on a daily chart, a familiar falling wedge is forming, which is a sign of a potential bullish reversal.
The price is currently testing a crucial point of downward resistance, which is located at $1.370. Breaking through this point will confirm this reversal, thus ending a long run of lower highs.
According to crypto analyst ZAYK Charts, the key horizontal supports remain firm at $1.130, with the immediate resistance levels at $1.370.

Source: @ZAYKCharts
Once the breakout occurs, the first psychological barrier will be at $1.900. Beyond that, a strong run could be expected towards the key structural resistance and the ultimate target at $2.427.
The projected move suggests an $81.88% increase, which will add $1.090 to the current base price.
Traders should look for the volume to confirm the breakout. The key to the strategy is to hold the $1.210 support before making the move to the final target.
Momentum Indicators Show Strengthening Trend
From an indicator’s perspective, the RSI (14) is currently at 53.12, which indicates a neutral-to-bullish change in momentum for Toncoin.
The asset rebounded from the 30.00 oversold floor in early March, and currently, the RSI is above its yellow signal line at 46.12.
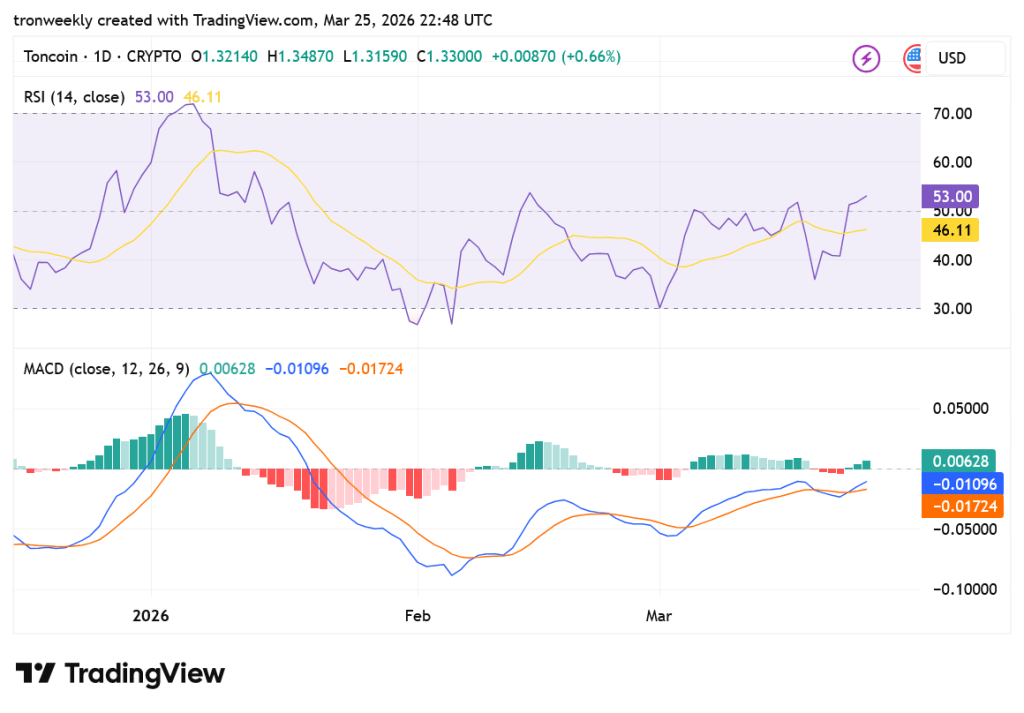
Source: TradingView
As can be seen, a bullish crossover signal has been generated by the MACD, as the blue line, currently at -0.01088, crosses over the orange signal line, currently at -0.01722.
Although still in negative territory, the histogram, currently turning green at 0.00634, suggests that buying pressure is increasing as bearish momentum decreases.
This article contains market analysis and price predictions. These are not guarantees. Crypto markets are volatile. Always DYOR. Not financial advice.
Also Read: Toncoin (TON) Eyes 28% Surge Despite Bearish Fear

Be the first to comment