


What to know:
- Tron Inc. bought 156,819 TRX, raising holdings to 689M+ tokens and strengthening its long-term crypto treasury strategy.
- Analysts see upside targets at $1, $2, and $3 amid growing momentum and sustained bullish market sentiment.
- RSI and MACD show strong buying pressure, with a possible short-term pullback due to overbought conditions signals.

Tron Inc. expanded its digital asset reserves by acquiring 156,819 TRON (TRX) tokens, at an average price of $0.3188.
This latest purchase pushes its total holdings beyond 689.1 million TRX, reflecting a steady accumulation strategy and reinforcing the company’s growing commitment to strengthening its cryptocurrency treasury position over time.


Source: TRONSCAN

The firm stated it will continue building its Tron Digital Asset Treasury to support long-term shareholder value.
By increasing exposure to TRX, Tron Inc. is aligning itself with the broader growth of the TRON ecosystem, signaling confidence in its future potential and positioning the company to benefit from sustained adoption and market expansion.
Also Read: Tron Inc. Expands Digital Asset Treasury as TRX Poised for $0.40 Break
TRON (TRX) Strong Accumulation Points to $2+ Rally
Following this institutional investment, the price of TRON (TRX) is displaying a strong accumulation pattern on the monthly chart, with the price remaining well above the $0.28 to $0.23 price zone following a liquidity sweep at the $0.45 price level.
According to the crypto analyst Crypto Patel, the long-term ascending trend line, which has remained in place since 2018, continues to provide strong support to the price, creating a strong bull structure with macro wedge compression signals of an impending price breakout.
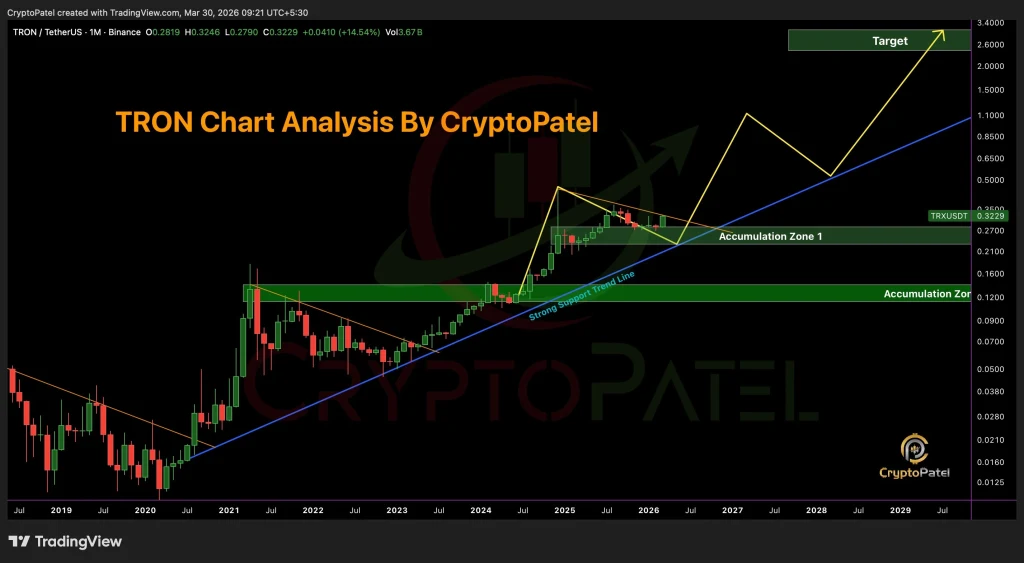
Source: Crypto Patel’s X Post
Crypto Patel points to the range of $0.28 to $0.22 as an important entry level, with price targets of $1, $2, and $3 if the momentum is maintained.
The tightening range could be an indication of an explosive move soon, which could put TRX in price discovery territory. However, if the price closes below $0.20 in the month, it could be a warning of underlying weakness in the trend.
Momentum Indicators Point to Strong Bullish Recovery
According to TradingView, the relative strength index for the asset indicates that the asset is in an overbought position. The relative strength index value for the asset is at 72.38.
This indicates that the asset is in a position that will experience a correction in the coming days. The asset is likely to reach the highest RSI value when it touches the previous resistance levels.

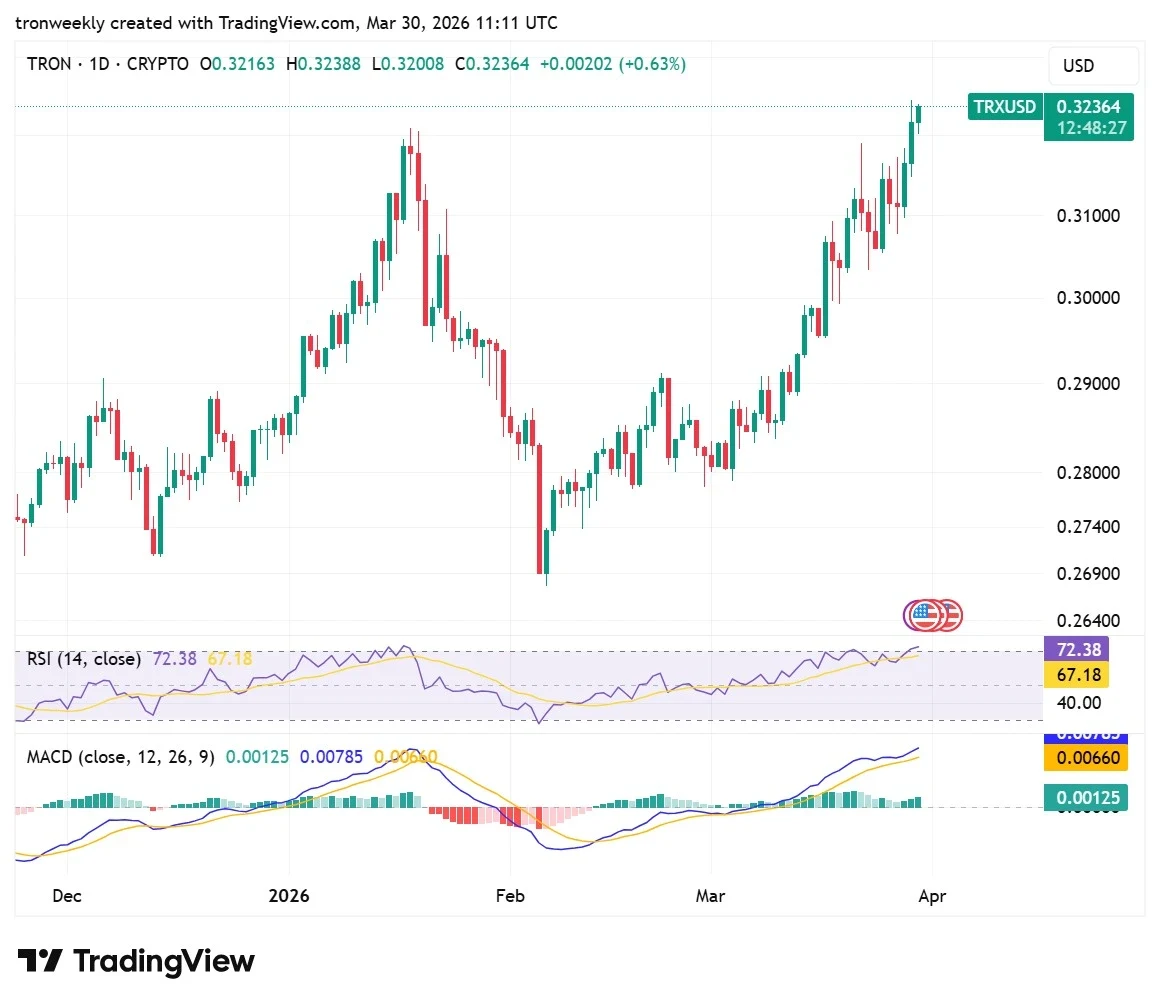
Source: TradingView
Moreover, the MACD indicator also confirms the bullish trend, as the blue line is nicely placed above the signal line.
The histogram is also showing increasing positive bars, indicating that buying is increasing in the market. However, the distance from the zero line indicates that the market is running hot in the current price range.
This article contains market analysis and price predictions. These are not guarantees. Crypto markets are volatile. Always DYOR. Not financial advice.
Also Read: Tron Inc.’s TRX Accumulation Hint at a Potential Breakout Above $0.35

Be the first to comment