


What to know:
- Tron Inc. (NASDAQ: TRON) bought 161,173 TRX, raising its total holdings to over 688.3 million tokens.
- TRX price stays bullish above the 20-EMA, with $0.313 acting as key breakout resistance.
- RSI and MACD indicators show growing momentum and a possible upward trend.


Tron Inc. (NASDAQ: TRON) expanded its digital asset treasury after purchasing 161,173 TRX tokens, at an average price of $0.3102. Following the acquisition, the company’s total TRX holdings surpassed 688.3 million tokens, reinforcing its strategy of building a large cryptocurrency reserve as part of its long-term balance sheet growth plan.


Source: TRONSCAN

The company said the purchase will be added to its Tron Digital Asset Treasury (DAT), which is designed to strengthen financial stability and increase long-term shareholder value.
Tron Inc. stated it plans to continue growing its TRX holdings over time, citing strong confidence in the Tron ecosystem and the token’s future role in blockchain-based finance and payments.
Also Read: TRON (TRX) Faces Short-Term Pressure Near $0.30 as Volume Declines
TRX Technical Outlook Shows Sustained Bullish Recovery
Following this institutional accumulation, the price of TRX is on a steady climb on the weekly chart, trading around $0.310. As per Trading View, the price is holding above the 20 EMA at $0.296.
This indicates strength in the price. However, resistance for the price is seen around the upper Bollinger Band at $0.313. To trade back to the highs of early 2025, a strong weekly close is required.
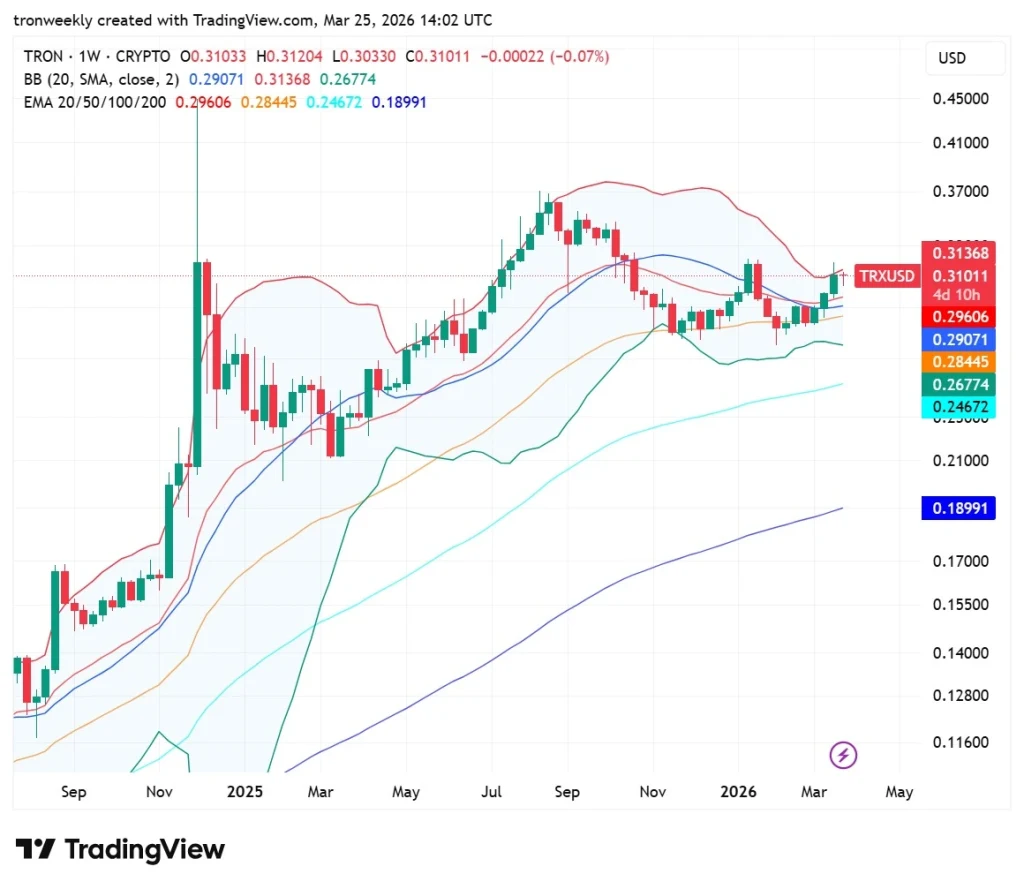
Source: TradingView
On the other hand, the 50-EMA at $0.284 represents a key secondary support level. In case the current sideways movement loses momentum, a pullback towards the middle Bollinger Band at $0.290 can be expected.
Although the overall trend remains bullish, the narrowing range suggests that a volatility squeeze is due in the near future. Traders should be on the lookout for a high-volume breakout in either direction.
Momentum Indicators Support Bullish Reversal
The Relative Strength Index is currently at 56.10, moving quietly past the 49.57 signal line. This position suggests that the relative strength index is developing some budding momentum as it remains well above the critical 50 level.
The price has sufficient space to rise without the threat of exhaustion, given that it remains well below the critical 70 level.

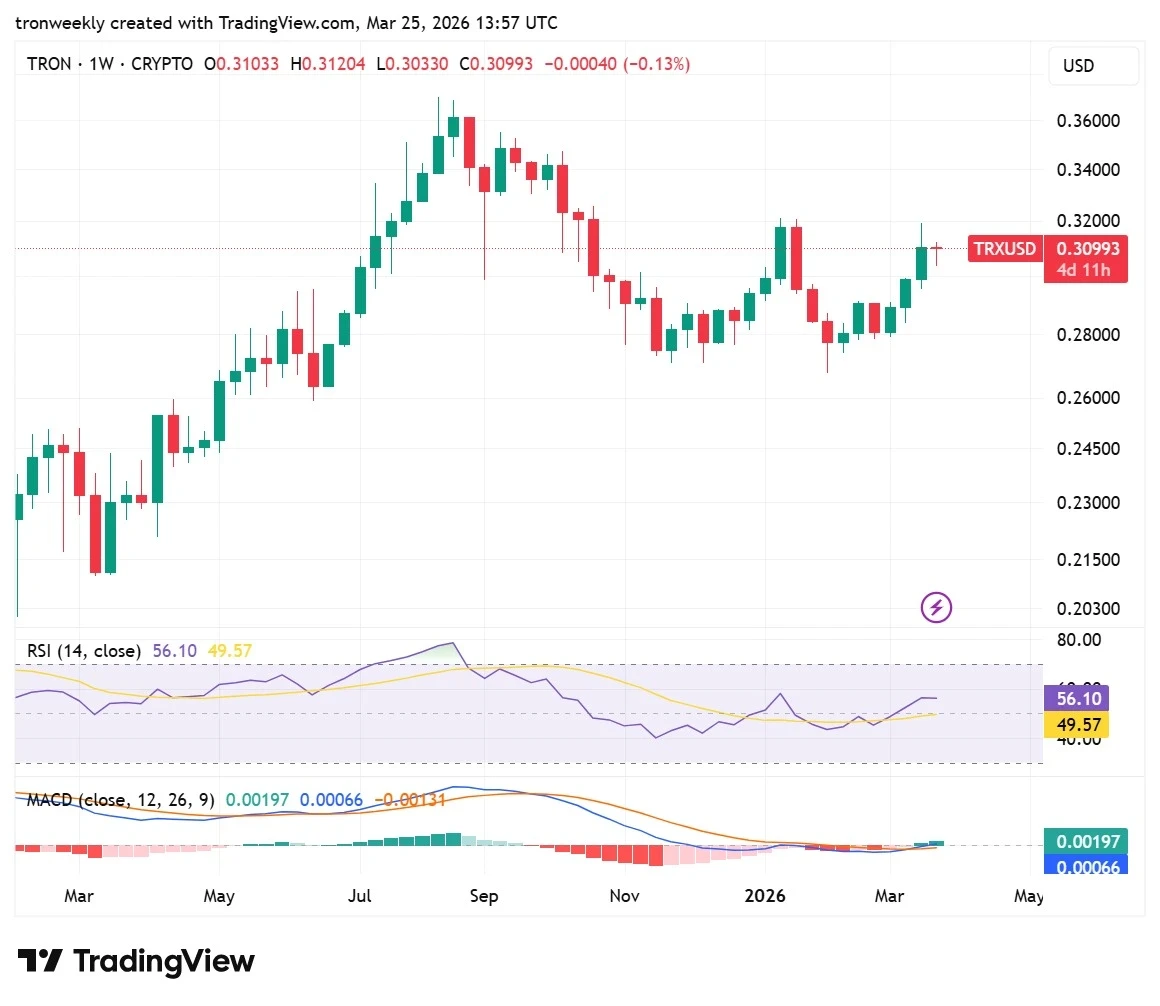
Source: TradingView
The turning point is indicated by the MACD signal, where the blue MACD line rises above the orange signal line.
The series of red histograms finally gives way to green bars, a sign that buying pressure is finally building up. As the lines are still near zero, the crossover suggests a possible change in direction towards a stronger bull run.
This article contains market analysis and price predictions. These are not guarantees. Crypto markets are volatile. Always DYOR. Not financial advice.
Also Read: TRX Bullish Momentum Strengthens Amid Tron Treasury & Network Growth

Be the first to comment