


What to know:
- Tron Inc. boosts TRX holdings to 690M+ tokens with a recent 157,624 purchase at $0.3172, reinforcing its accumulation strategy.
- TRX maintains bullish momentum, pushing toward key Fibonacci resistance near $0.3208.
- RSI and MACD indicators remain supportive, showing sustained buying pressure and trend strength.

Tron Inc. (NASDAQ: TRON) has expanded its cryptocurrency treasury by purchasing 157,624 TRX tokens, at an average price of $0.3172 per token, according to the latest update.
This acquisition increases the company’s total TRX holdings to more than 690 million tokens, reflecting continued accumulation of its native digital asset for a strategic balance sheet growth strategy.

Source: TRONSCAN

Beyond the latest purchase, Tron Inc. continues to pursue a treasury accumulation strategy aimed at strengthening long-term shareholder value and reinforcing its position within the Tron ecosystem.
The company’s consistent acquisitions suggest confidence in TRX fundamentals while also aligning its corporate balance sheet with broader blockchain network growth and future utility expansion initiatives ahead.
Also Read: Tron Inc.’s TRX Accumulation Signals Possible Breakout Toward $0.40
TRX Shows Bullish Outlook Above Key Fib Levels
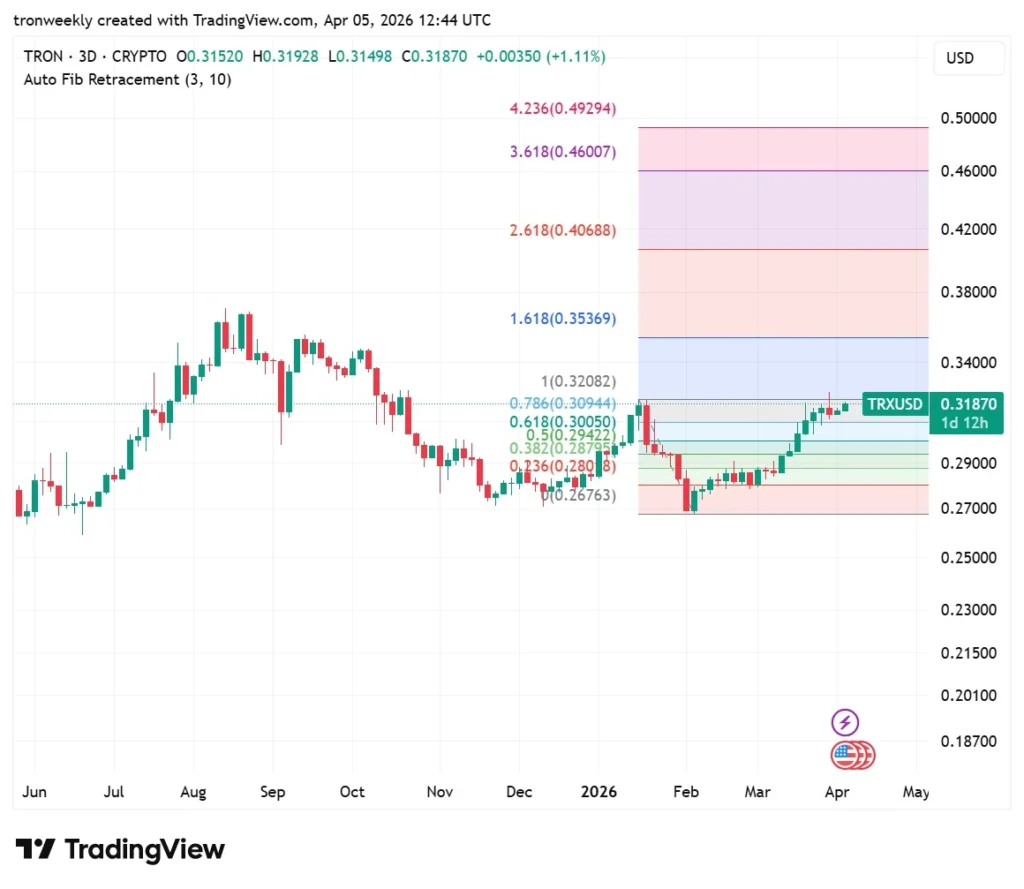
Following this major institutional investment, TRX shows a recovery after hitting a local low of $0.267 in February. According to TradingView, trading at $0.3187, the price has surpassed key Fibonacci levels like $0.236 and $0.618.
This steady ascent indicates a shift from volatility to a bullish trend. The asset is currently testing resistance near the crucial $1.0 Fibonacci level of $0.3208.
Source: TradingView
Breaking above $0.3208 is suggestive of the trend extending further upwards towards the higher extension levels.
Resistance can be found at $0.3536, while the extended targets can be located at $0.4068 and $0.4929. There are still more than 24 hours left before the expiry of the current session, and the momentum remains strong.
Momentum Indicators Support Strong Bullish Reversal
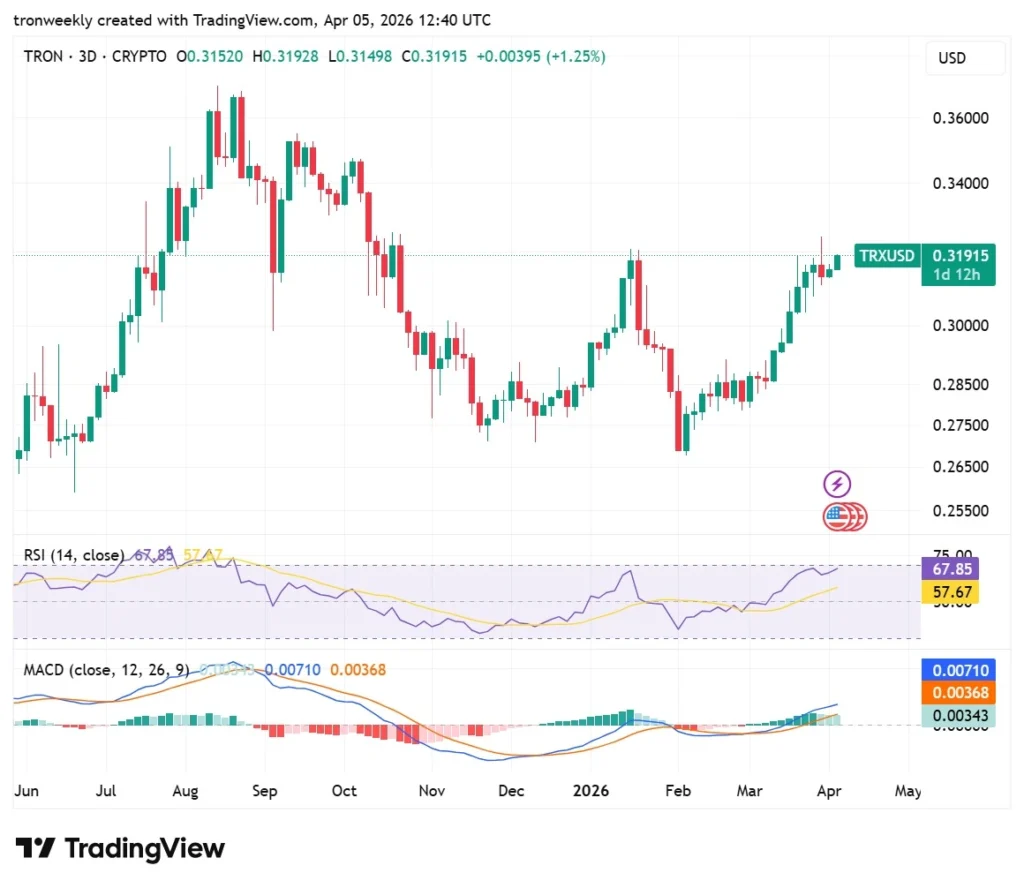
The RSI value is currently at 67.85, indicating that the asset is in an excellent bull zone slightly below the overbought level. The asset moving above the 14-period SMA shows that there is consistent buying pressure.
Normally, this value indicates that the asset will experience sideways movement before reaching the highs registered in August.
Source: TradingView
MACD indicates an obviously bullish scenario where the blue MACD line is positioned well above the signal line. The increasing number of green histogram bars shows the rise in the momentum as the token tests its previous resistance level.
Furthermore, there is no immediate bearish crossover coming, implying that volume indicators support the current trend.
This article contains market analysis and price predictions. These are not guarantees. Crypto markets are volatile. Always DYOR. Not financial advice.
Also Read: TRX Price Targets $0.32 Breakout as TRON Inc. Adds 159K Tokens to Treasury

Be the first to comment