


What to know:
- VeChain (VET) is currently in a downward consolidation phase, with the price testing a crucial support.
- The long-term descending channel indicates continued bearish pressure, though a short-term rebound is possible.
- Key resistance levels to monitor are $0.015, $0.030, $0.055, $0.080, and $0.160 in case of a bullish breakout.

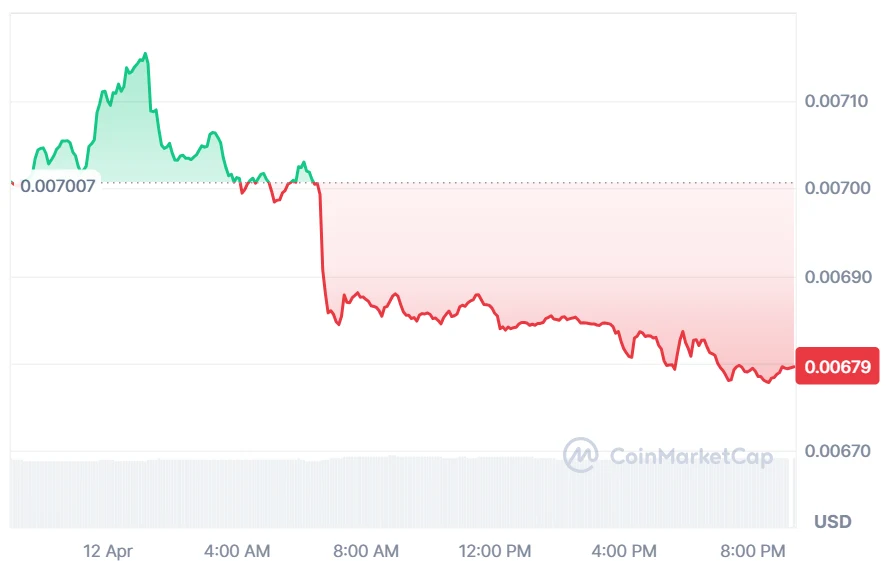
VeChain (VET) is moving in a downward consolidation phase following the slight calmness in the crypto market. According to CoinMarketCap, the VET price has declined 2.9% over the last 24 hours and 9.6% over the last week.
At the time of writing, VET is trading at $0.006804, with a trading volume of $21.14 million, which has surged by 2.73% over the last 24 hours. However, its market capitalization stands at $585.04 million, which has declined by 2.9%.

Source: CoinMarketCap

Also Read: VeChain Price Prediction: VET Breakout Signals Upside Move
VET Price Action Signals Recovery Toward $0.160
Furthermore, the crypto analyst Jonathan Carter shows that VeChain (VET) is trading within a long-term descending channel on the weekly chart, reflecting sustained bearish structure with lower highs and lower lows.
The price is approaching a key support zone where buyers may attempt a rebound, potentially signaling short-term recovery momentum within the broader downtrend if demand strengthens significantly in current market conditions today.

Source: Jonathan Carter’s X Post
As stated by technical analysts, if the upward bounce manages to be sustained, VET will move higher toward several resistance levels, including $0.015, $0.030, $0.055, $0.080, and even possibly $0.160 under a bullish breakout situation.
But for now, the bearish trend is still in place, and there needs to be sufficient volume to signal a possible change in trend direction.
VET Technical Outlook Reveals Downward Pressure
According to TradingView, VET is in a continuous bearish pattern since late 2025, where there are regular lower highs.
Currently, the price is near $0.00680 and has difficulty sustaining itself above the middle line of the 20-day Simple Moving Average. The Bollinger Bands have shrunk considerably, and the market may be consolidating in preparation for an eventual breakout.

Source: TradingView
Momentum indicators show bearish indecision, as shown by the MACD indicator being near-zero. The RSI value at 43.27 shows the buyers seem to be in control, though they have not managed to enter an overbought state.
In order to reverse the trend, VET has to recapture its resistance level of $0.00754 or test its support level of $0.00643.
This article contains market analysis and price predictions. These are not guarantees. Crypto markets are volatile. Always DYOR. Not financial advice.
Also Read: VeChain (VET) at a Turning Point: Will $0.0115 Breakout Happen Next?

Be the first to comment