


What to know:
- SUI remains under bearish pressure below key levels with falling volume and weekly losses.
- Price struggles below $0.92 resistance as repeated bounces face strong selling pressure.
- RSI at 38.68 and MACD below the signal line confirm continued weak market momentum.

SUI is still facing sustained selling pressure as of March 31, 2026, with the structure of its prices showing a clear bearish trend. It is still trading below the relevant levels with falling volumes and weekly losses.
As of writing, SUI is trading at $0.8590, showing a decline of 2.53% in the past 24 hours. The trading volume is down by 15.59% and is currently standing at $300.38 million. Over the last week, the token price has decreased by 8.63% according to CoinMarketCap.
SUI Stays Bearish Below Key Levels
The technical setup still remains on the downside. Analyst Cryptorphic pointed out that SUI is trading below a trend line. However, the asset is trading below key moving averages. This indicates a bearish setup in the current phase.

Each time there is a short-term bounce, there is selling pressure on the asset. There are no indications of strong buying activity in the market. The analyst pointed out that there are repeated attempts to go higher, but they are rejected.
The $0.90-$0.92 price range is a key resistance level for SUI. The asset has not managed to close above this level so far. As long as SUI is trading below this level, there is a risk of downside. A break above this zone is required to shift sentiment.
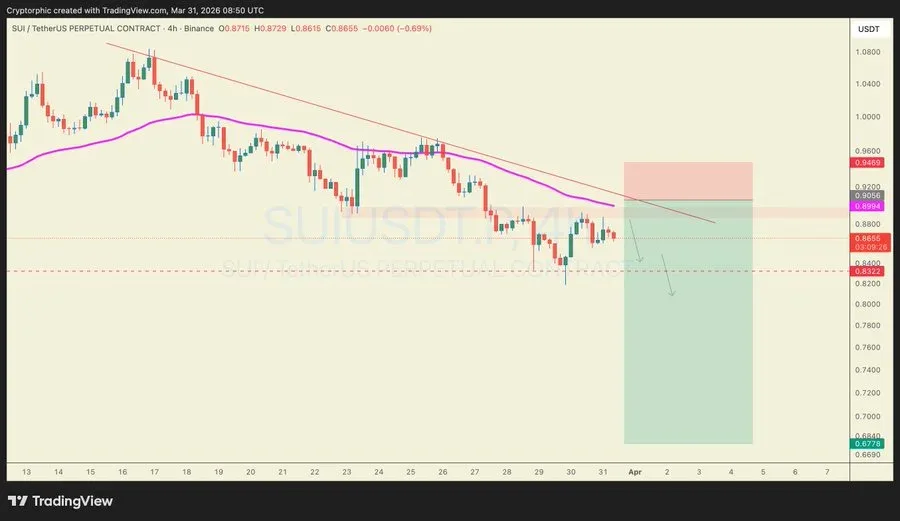

These trading strategies follow the bearish sentiment. Short positions at current levels can be considered reasonable. A stop loss above $0.95 is recommended. Target prices for the downward movement are set around the $0.80 level.
Also Read: SUI Faces Critical $0.88 Resistance After Testing $0.84 Support Zone
Derivatives Signal Weak Market Sentiment
Derivatives data is also showing weakening sentiment. According to CoinGlass data, the future volume is falling by 11.41% to $555.40 million. Open interest is also down by 2.73% to $428.46 million. The OI Weighted Funding is at 0.0055%.
Liquidation data indicates the recent market pressures. Total liquidations stood at $769.94K in the last 24 hours. Long positions stood at $309.83K. Short liquidations were higher at $460.12K.
RSI and MACD Signal Weak Momentum
The Relative Strength Index (RSI) is at 38.68, which is lower than the neutral point at 50. This indicates low momentum in the market. The moving average for the RSI is at 43.50. This suggests limited buying strength in the market.
The Moving Average Convergence Divergence line is at -0.0305, which remains below the signal line at -0.0200. The histogram remains in negative territory, recording -0.0105. This indicates that there is continued bearish pressure in the near term.
This article contains market analysis and price predictions. These are not guarantees. Crypto markets are volatile. Always DYOR. Not financial advice.
Also Read: NEAR Protocol (NEAR) Price Slides: Will $1.16 Support Hold or Break?

Be the first to comment