

What to know:
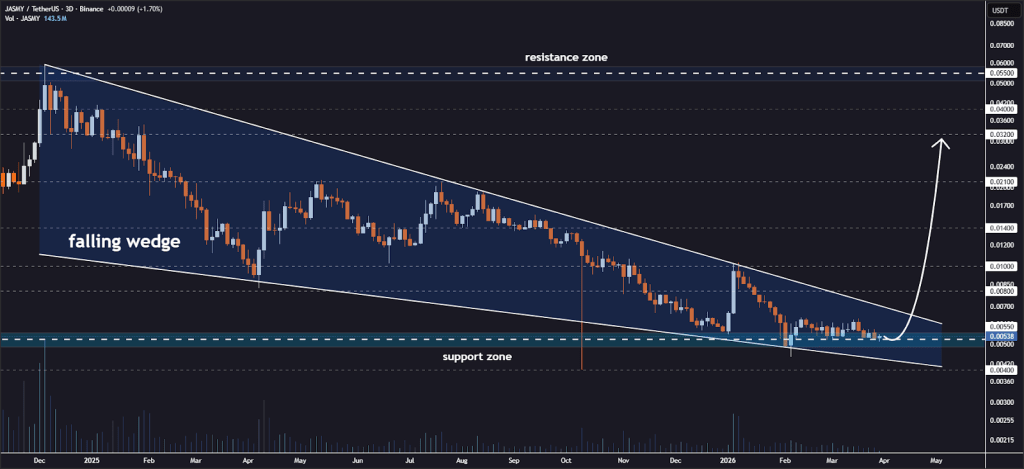
- JASMY is testing falling wedge support, hinting at a possible bullish reversal if buyers hold the zone.
- Key upside resistance levels stand at $0.008, $0.010, $0.014, $0.021, and $0.032 if momentum shifts upward.
- RSI near 47 and weak MACD signal market indecision and low bullish strength.

JasmyCoin is currently testing the lower boundary of a falling wedge on the 3-day chart, a structure often associated with weakening bearish momentum.
According to the crypto analyst Jonathan Carter, the price action is tightening, suggesting a potential accumulation zone where buyers may gradually absorb selling pressure, setting the stage for a possible bullish reversal if support holds.
Source: Jonathan Carter’s X Post

If momentum shifts upward, traders are watching key breakout targets at $0.008, $0.010, $0.014, $0.021, and $0.032 as potential resistance levels during recovery.
However, a breakdown below $0.004 would invalidate the bullish setup, making it a critical stop-loss area for risk management as the market decides its next directional move.
Also Read: JasmyCoin (JASMY) Could Skyrocket to $0.2785 Amid Bullish Market Setup
JasmyCoin Technical Outlook Reveals Downside Pressure
According to TradingView, JasmyCoin is in a gradual downtrend, with its price stuck below all significant Exponential Moving Averages.
The next barrier is at the 20 EMA at $0.00535, with the 200 EMA at $0.00566 being an extremely remote milestone. Sellers remain in control as JASMY continues to struggle with building a strong base.

Source: TradingView
This is evident in the tightening Bollinger Bands, which is an indication of a possible volatility squeeze in the future.
Support is still present at $0.00522, but the inability to close above the median band indicates underlying weakness. A close above $0.00545 is needed to shift the short-term bias to neutral, as it is currently biased lower.
Momentum Indicators Show Bearish to Neutral Setup
Currently, the Relative Strength Index (RSI) for JASMY is at 47.51. This indicates that the overall mood in the market is neutral. The price is still below the middle point, suggesting that the bullish pressure is not too strong.
The price is moving sideways without going into overbought or oversold levels. This indicates that it is in a consolidating phase.

Source: TradingView
The MACD indicator is indicating a minor bullish signal with a slight rise of the blue line above the orange line. However, both lines remain below the zero line, which indicates that the trend is still bearish.
The histogram is showing weak green bars, indicating that there is some buying pressure building up but not strong enough to initiate a strong reversal.
This article contains market analysis and price predictions. These are not guarantees. Crypto markets are volatile. Always DYOR. Not financial advice.
Also Read: JasmyCoin (JASMY) Falling Wedge Signals Potential Breakout to $0.021

Be the first to comment