


What to know:
- ADA stays below $0.266 resistance, keeping the trend weak despite a slight volume increase.
- Key support at $0.227–$0.233 holds as RSI and MACD signal weak momentum.
- Derivatives show a bearish bias as the funding rate turns negative and OI rises slightly.

Cardano (ADA) remained under pressure on the daily chart as the price stayed below a key resistance level. Market data showed limited strength, while trading activity rose slightly, reflecting cautious participation and a lack of clear directional momentum.
According to CoinMarketCap data, ADA is trading at $0.2524. The price declined by 1.15% over the past 24 hours. Trading volume increased by 7.68% to $449.92 million. Over the past month, the token has dropped 3.4%, reflecting sustained selling pressure.
Also Read: Hyperliquid (HYPE) Breaks Out as Bulls Defend $41–$42 Support Zone Level Holds

ADA Holds Below $0.266 as Weak Structure Limits Upside
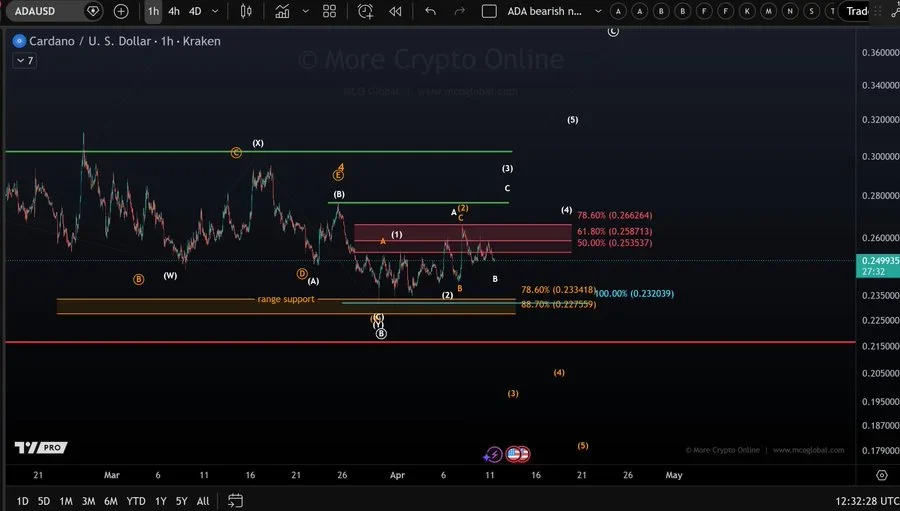
Analyst MCO Global highlighted that ADA continues to trade below the $0.266 resistance level. This level has capped recent upward attempts. The price movement from the March low remains overlapping. It does not show a clear impulsive structure.
A move above $0.266 could change the short-term outlook. The analyst noted that such a breakout may lead to a C-wave move. In that case, the price could target the $0.276 range. Until then, upside potential remains limited.
Support levels remain clearly defined on the chart. The primary support zone lies between $0.227 and $0.233. This range continues to act as a downside buffer.

CoinLore data shows that $0.2483 has recently worked as short-term support. Resistance continues to be relatively high on the chart.
However, the price range will increase if a move through $0.3119 resistance happens. The resistance levels are placed at $0.3508 and $0.3851.
ADA Sees Higher Volume and OI Amid Bearish Sentiment
Derivatives data show negative sentiment. According to CoinGlass data, trading volume increased by 0.75% to $579.52 million. Open interest moved up by 1.64% to $429.97 million. The OI-weighted funding rate is equal to -0.0083%, which means that bears dominate the market.
RSI Below 50 as MACD Signals Limited Momentum
According to TradingView data, the Relative Strength Index (RSI) has neutral conditions. The RSI is currently at 48.11. The RSI moving average is equal to 44.64. Both indicators show negative momentum because their readings are below the neutral 50 level.
The MACD indicator shows early but limited signals. The MACD line and the signal line are -0.0031 and -0.0047, respectively. As a result, the histogram’s value is slightly positive and equals 0.0017. These readings indicate that there is no clear bias at the moment.
This article contains market analysis and price predictions. These are not guarantees. Crypto markets are volatile. Always DYOR. Not financial advice.
Also Read: Cardano (ADA) Holds $0.25 as Market Eyes Potential Move Toward $1.17

Be the first to comment