


What to know:
- Worldcoin (WLD) is trading near $0.2504, showing short-term stability despite a 10.52% weekly decline.
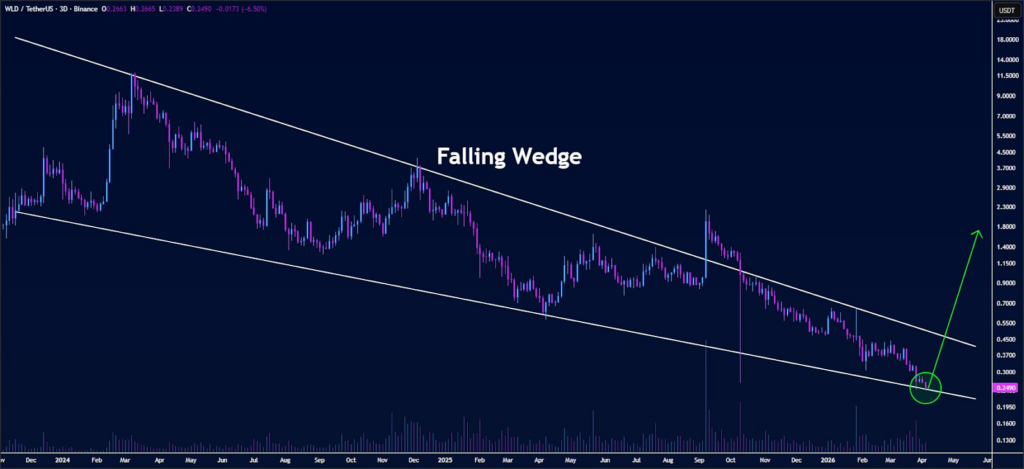
- A falling wedge pattern on the 3-day chart suggests a potential bullish breakout if key support holds.
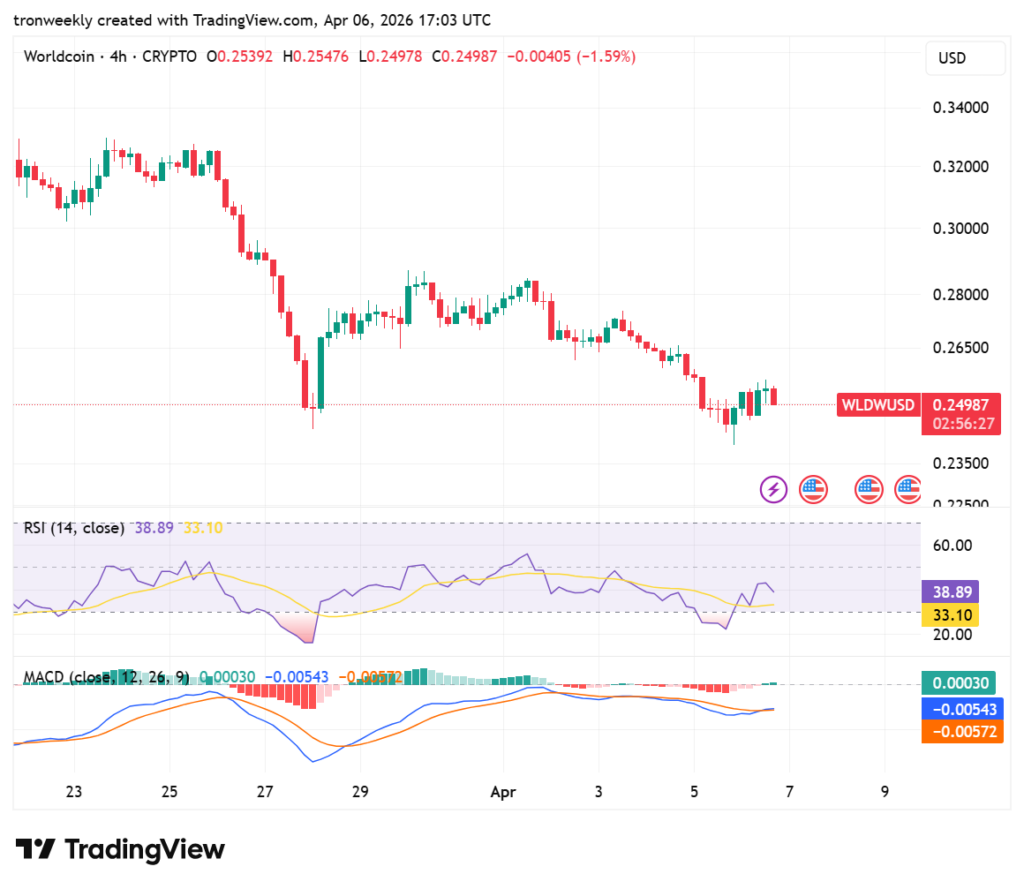
- RSI at 38.89 reflects weak momentum and continued selling pressure without reaching oversold levels.

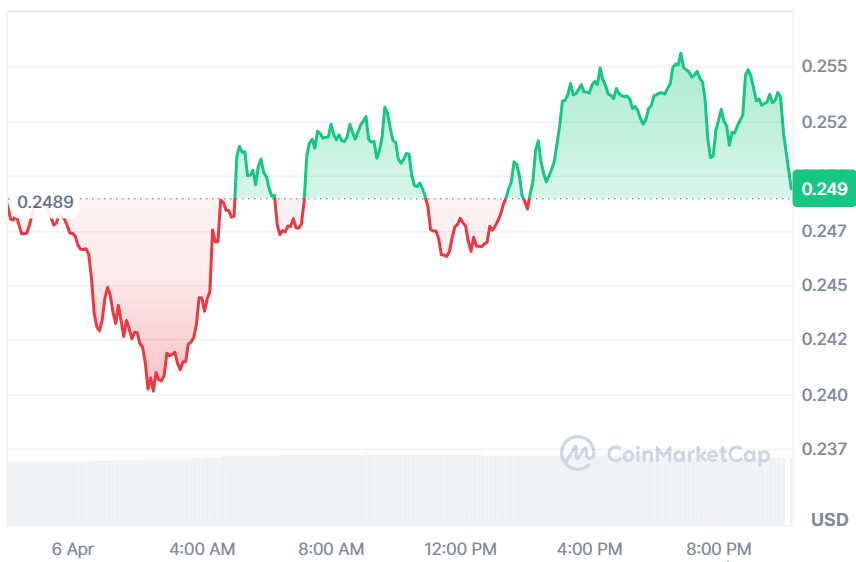
Worldcoin (WLD) is currently in a bearish to neutral phase after a prolonged downtrend in the crypto market. According to CoinMarketCap, the WLD price has shown stability over the last 24 hours but declined by 10.52% over the last week.
At the time of writing, Worldcoin is trading at $0.2504, supported by a trading volume of $167.22 million, which has surged by 7.38% over the last 24 hours. However, its market capitalization stands at $813.95 million, which is also up by 1.14%.
Source: CoinMarketCap

Also Read: WLD Price Prediction: Will This 98% Dip Turn Into the Next Bull Run?
WLD Falling Wedge Signals Breakout Toward $1.80
Worldcoin (WLD) is currently pressing against the lower boundary of a falling wedge pattern on the 3-day timeframe, a structure that often signals an approaching volatility breakout.
According to the crypto analyst, price action has repeatedly tested this support zone, where strong buying pressure continues to absorb sell-offs, suggesting active accumulation as the market compresses.
Source: Butterfly’s X Post
If this key level continues to hold, WLD could be setting up for a bullish reversal with expanding momentum out of the wedge.
A breakout from this structure would open the path toward higher resistance zones, with the $1.80 area emerging as a potential upside target if buyers sustain control and trend strength returns.
Momentum Indicators Point to Downward Pressure
According to TradingView, the WLD pattern indicates bearish momentum as the RSI is at 38.89. This is a rather poor reading, which means that selling activity continues to dominate the market but not enough to reach the oversold region. The momentum remains fairly subdued since the indicator is hovering around its moving average line.
Source: TradingView
The MACD indicates that there is a strong downward trend, since both lines are below the zero line. However, the histogram oscillates above the zero line at 0.00030, indicating that there might be a slight weakening of the bearish pressure.
Although there is no bull crossing point on the chart, the squeezing gap suggests that the selling pressure could be diminishing.
This article contains market analysis and price predictions. These are not guarantees. Crypto markets are volatile. Always DYOR. Not financial advice.
Also Read: Worldcoin (WLD)’s Reclaim Above $0.66 Could Trigger Macro Rally Above $10
Be the first to comment