


What to know:
- XRP shows signs of recovery with improving short-term momentum.
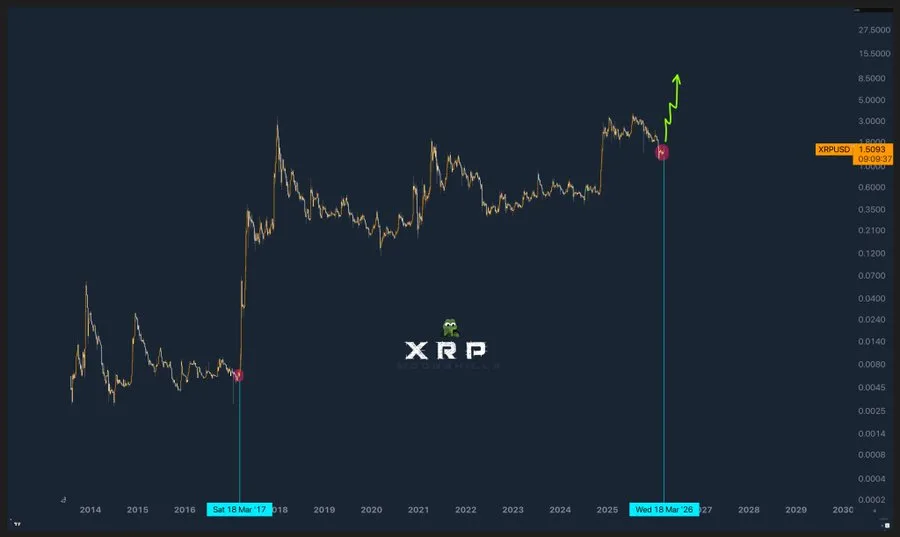
- Price structure hints at a possible cycle similar to the 2017 rally.
- Major resistance levels still limit a confirmed long-term breakout.


Analyst Pepa highlighted a striking historical detail, pointing out that XRP began its major 2017 rally. This observation has renewed interest in whether the asset could be approaching a similar phase.
Long-term chart data supports this discussion, showing a repeating pattern of extended consolidation followed by sharp upward moves.

From 2014 to 2017, it remained in a quiet and low-activity period. Then it took off strongly in 2017 in a bull run. After it reached a high, it corrected hard in a long period, reflecting a loss in momentum and a move into a distribution period.
From 2018 to 2022, XRP formed a wide base. The price traded in a range, but the base was forming better little by little, with higher lows starting to appear, indicating that long-term investors were buying the asset.

Source: X
The base was forming in preparation for a potential trend change. However, XRP has been acting more positively from 2023 to 2025. The breakout above the previous resistance levels indicates that the market is targeting a bullish period.
The latest move has a strong move and a steady pullback; this suggests that the move will continue and not reverse.
Also Read: XRP Price Stalls Below Resistance as Analysts Eye $4 Move
XRP Short-Term Recovery Gains Strength
Recent analysis by TradingView indicates that the market has slowly stabilized after its long fall. For instance, since the end of 2025, XRP has been characterized by lower highs and lower lows.
This indicates that the token has been in a bearish trend. Nevertheless, the sudden fall in early February may have created a bottom.
After the fall, the token’s movement has been characterized by a period of sideways movement and stabilization. XRP currently trades at $1.53 and has moved above the 20 and 50 exponential moving averages.

Source: TradingView
The 100-day EMA near $1.70 and the 200-day EMA near $1.95 are still providing strong resistance. These two EMAs have formed a zone that may impede further increases unless fueled by even stronger buying power. Another key change in the indicators is in the volatility sector.
Bollinger Bands have been compressing during the consolidation period and are expanding as the stock is rising. XRP is close to the upper band, indicating an increase in its power but also making it more likely to fall back in the near future.
Momentum Indicators Show Strengthening Trend
The momentum indicators are showing improvement. The RSI is above the 60-mark, indicating more buying pressure but not yet overbought.
The MACD is also positive with a bullish crossover. XRP is forming a base with higher lows. The resistance levels are around $1.60 and $1.70. If the price breaks this level, it could go up to $1.95 and then $2.00.

Source: TradingView
This article contains market analysis and price predictions. These are not guarantees. Crypto markets are volatile. Always DYOR. Not financial advice.

Be the first to comment